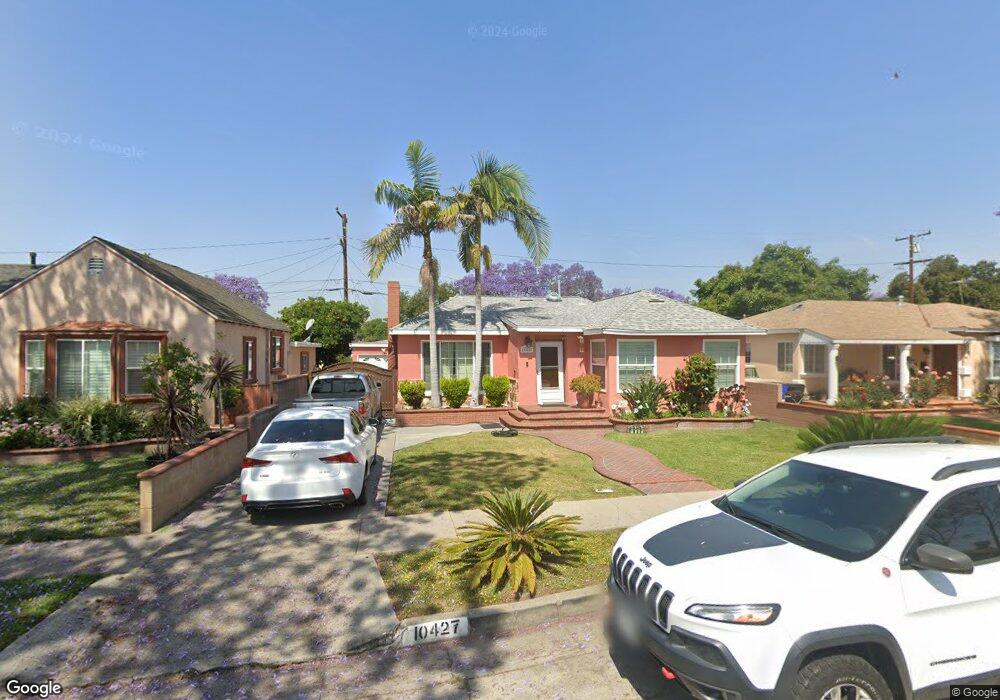
10427 Hunt Ave South Gate, CA 90280
Estimated Value: $678,709 - $800,000
2
Beds
1
Bath
1,580
Sq Ft
$473/Sq Ft
Est. Value
About This Home
This home is located at 10427 Hunt Ave, South Gate, CA 90280 and is currently estimated at $747,427, approximately $473 per square foot. 10427 Hunt Ave is a home located in Los Angeles County with nearby schools including Bryson Avenue Elementary School, South Gate Middle School, and Southeast Middle School.
Ownership History
Date
Name
Owned For
Owner Type
Purchase Details
Closed on
Dec 19, 2018
Sold by
Noya Marcos and Noya Blanca
Bought by
Noya Morcos G and Noya Blanca E
Current Estimated Value
Purchase Details
Closed on
Sep 6, 1998
Sold by
Washington Mutual Bank Fa
Bought by
Noya Marcos and Noya Blanca
Home Financials for this Owner
Home Financials are based on the most recent Mortgage that was taken out on this home.
Original Mortgage
$151,227
Outstanding Balance
$32,248
Interest Rate
6.88%
Mortgage Type
FHA
Estimated Equity
$715,179
Purchase Details
Closed on
Mar 17, 1998
Sold by
Uribe Gabriel
Bought by
Washington Mutual Bank Fa and American Svgs Bank Fa
Purchase Details
Closed on
Jul 26, 1993
Sold by
Sandoval Efren
Bought by
Uribe Gabriel and Uribe Librada
Home Financials for this Owner
Home Financials are based on the most recent Mortgage that was taken out on this home.
Original Mortgage
$154,600
Interest Rate
4.6%
Create a Home Valuation Report for This Property
The Home Valuation Report is an in-depth analysis detailing your home's value as well as a comparison with similar homes in the area
Home Values in the Area
Average Home Value in this Area
Purchase History
| Date | Buyer | Sale Price | Title Company |
|---|---|---|---|
| Noya Morcos G | -- | None Available | |
| Noya Marcos | $154,000 | Investors Title | |
| Washington Mutual Bank Fa | $142,700 | Stewart Title | |
| Uribe Gabriel | $172,000 | Old Republic Title Company |
Source: Public Records
Mortgage History
| Date | Status | Borrower | Loan Amount |
|---|---|---|---|
| Open | Noya Marcos | $151,227 | |
| Previous Owner | Uribe Gabriel | $154,600 |
Source: Public Records
Tax History Compared to Growth
Tax History
| Year | Tax Paid | Tax Assessment Tax Assessment Total Assessment is a certain percentage of the fair market value that is determined by local assessors to be the total taxable value of land and additions on the property. | Land | Improvement |
|---|---|---|---|---|
| 2025 | $3,460 | $241,398 | $124,461 | $116,937 |
| 2024 | $3,460 | $236,666 | $122,021 | $114,645 |
| 2023 | $3,404 | $232,027 | $119,629 | $112,398 |
| 2022 | $3,252 | $227,479 | $117,284 | $110,195 |
| 2021 | $3,208 | $223,020 | $114,985 | $108,035 |
| 2019 | $3,112 | $216,407 | $111,575 | $104,832 |
| 2018 | $3,009 | $212,165 | $109,388 | $102,777 |
| 2016 | $2,867 | $203,929 | $105,142 | $98,787 |
| 2015 | $2,822 | $200,867 | $103,563 | $97,304 |
| 2014 | $2,824 | $196,933 | $101,535 | $95,398 |
Source: Public Records
Map
Nearby Homes
- 10307 Alexander Ave
- 10891 Standard Ave
- 10933 Sampson Ave
- 10611 San Luis Ave
- 9718 Otis St
- 9714 Otis St
- 9616 Bowman Ave
- 9643 Mallison Ave
- 4032 Le Sage St
- 10240 Atlantic Ave
- 10406 San Carlos Ave
- 11267 Sampson Ave
- 9525 Bowman Ave
- 9528 Mcnerney Ave
- 9611 Mallison Ave
- 10029 San Gabriel Ave
- 11309 Annetta Ave
- 10348 California Ave
- 9219 Alexander Ave
- 10249 California Ave
- 10421 Hunt Ave
- 10433 Hunt Ave
- 10426 Bryson Ave
- 10415 Hunt Ave
- 10439 Hunt Ave
- 10432 Bryson Ave
- 10420 Bryson Ave
- 10438 Bryson Ave
- 10414 Bryson Ave
- 10409 Hunt Ave
- 10503 Hunt Ave
- 10422 Hunt Ave
- 10418 Hunt Ave
- 10426 Hunt Ave
- 10412 Hunt Ave
- 10408 Bryson Ave
- 10430 Hunt Ave
- 10509 Hunt Ave
- 10500 Hunt Ave
- 10406 Hunt Ave