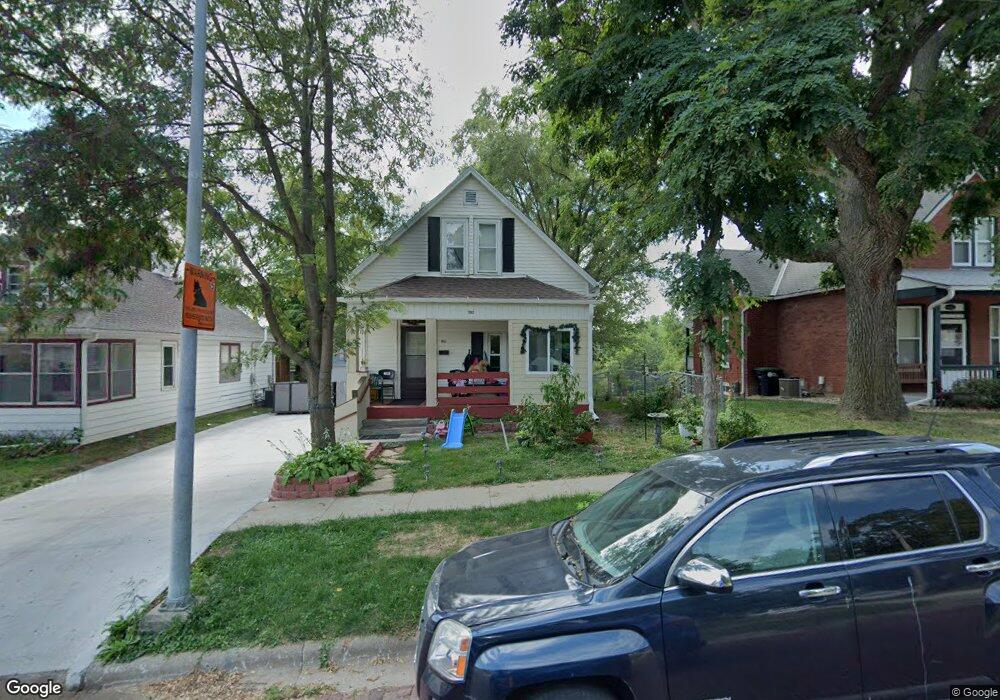
1043 Atlas St Omaha, NE 68107
South Central Omaha NeighborhoodEstimated Value: $156,000 - $171,000
3
Beds
1
Bath
1,010
Sq Ft
$163/Sq Ft
Est. Value
About This Home
This home is located at 1043 Atlas St, Omaha, NE 68107 and is currently estimated at $164,587, approximately $162 per square foot. 1043 Atlas St is a home located in Douglas County with nearby schools including Spring Lake Magnet Center, R.M. Marrs Magnet Middle School, and South High School.
Ownership History
Date
Name
Owned For
Owner Type
Purchase Details
Closed on
Aug 31, 2015
Sold by
Ochoa Antonia
Bought by
Ochoa Tsmuel and Ochoa Antonia
Current Estimated Value
Purchase Details
Closed on
Aug 20, 2003
Sold by
Semin Dolores M
Bought by
Ochoa Ismael and Ochoa Antonia
Home Financials for this Owner
Home Financials are based on the most recent Mortgage that was taken out on this home.
Original Mortgage
$77,000
Interest Rate
6.25%
Mortgage Type
Seller Take Back
Purchase Details
Closed on
Jul 7, 2003
Sold by
Resource Group Inc
Bought by
Semin Dolores M
Home Financials for this Owner
Home Financials are based on the most recent Mortgage that was taken out on this home.
Original Mortgage
$77,000
Interest Rate
6.25%
Mortgage Type
Seller Take Back
Purchase Details
Closed on
Jun 4, 2003
Sold by
Baker Cecila
Bought by
Resource Group Inc
Create a Home Valuation Report for This Property
The Home Valuation Report is an in-depth analysis detailing your home's value as well as a comparison with similar homes in the area
Home Values in the Area
Average Home Value in this Area
Purchase History
| Date | Buyer | Sale Price | Title Company |
|---|---|---|---|
| Ochoa Tsmuel | -- | None Available | |
| Ochoa Ismael | $80,000 | -- | |
| Semin Dolores M | $42,000 | -- | |
| Resource Group Inc | -- | -- |
Source: Public Records
Mortgage History
| Date | Status | Borrower | Loan Amount |
|---|---|---|---|
| Closed | Ochoa Ismael | $77,000 |
Source: Public Records
Tax History Compared to Growth
Tax History
| Year | Tax Paid | Tax Assessment Tax Assessment Total Assessment is a certain percentage of the fair market value that is determined by local assessors to be the total taxable value of land and additions on the property. | Land | Improvement |
|---|---|---|---|---|
| 2024 | $2,793 | $132,400 | $15,300 | $117,100 |
| 2023 | $2,793 | $132,400 | $15,300 | $117,100 |
| 2022 | $2,305 | $108,000 | $15,100 | $92,900 |
| 2021 | $1,996 | $94,300 | $15,100 | $79,200 |
| 2020 | $2,019 | $94,300 | $15,100 | $79,200 |
| 2019 | $1,572 | $73,200 | $4,600 | $68,600 |
| 2018 | $1,636 | $76,100 | $4,600 | $71,500 |
| 2017 | $1,644 | $76,100 | $4,600 | $71,500 |
| 2016 | $1,633 | $76,100 | $4,600 | $71,500 |
| 2015 | $1,611 | $76,100 | $4,600 | $71,500 |
| 2014 | $1,611 | $76,100 | $4,600 | $71,500 |
Source: Public Records
Map
Nearby Homes