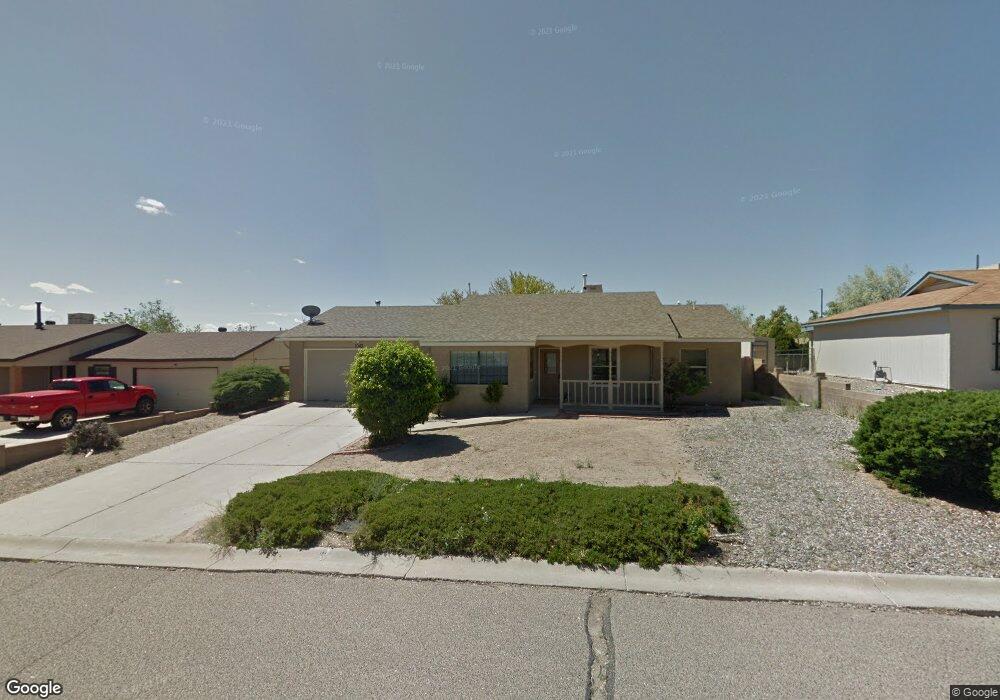
1043 Cascade Rd SE Rio Rancho, NM 87124
Solar Village-Mid-Unser NeighborhoodEstimated Value: $313,000 - $341,000
3
Beds
2
Baths
1,898
Sq Ft
$171/Sq Ft
Est. Value
About This Home
This home is located at 1043 Cascade Rd SE, Rio Rancho, NM 87124 and is currently estimated at $325,271, approximately $171 per square foot. 1043 Cascade Rd SE is a home located in Sandoval County with nearby schools including Puesta del Sol Elementary School, Eagle Ridge Middle School, and Rio Rancho High School.
Ownership History
Date
Name
Owned For
Owner Type
Purchase Details
Closed on
Apr 10, 2021
Sold by
Torres Jose M
Bought by
Torres Jose M and Torres Brandi N
Current Estimated Value
Home Financials for this Owner
Home Financials are based on the most recent Mortgage that was taken out on this home.
Original Mortgage
$147,800
Outstanding Balance
$122,321
Interest Rate
3%
Mortgage Type
New Conventional
Estimated Equity
$202,950
Purchase Details
Closed on
Oct 26, 2017
Sold by
Torres Jose M and Ortiz Brandi N
Bought by
Torres Jose M
Home Financials for this Owner
Home Financials are based on the most recent Mortgage that was taken out on this home.
Original Mortgage
$147,182
Interest Rate
3.75%
Mortgage Type
FHA
Purchase Details
Closed on
Dec 8, 2016
Sold by
Ortiz Steve and Ortiz Corrina
Bought by
Torres Jose M and Ortiz Brandi N
Home Financials for this Owner
Home Financials are based on the most recent Mortgage that was taken out on this home.
Original Mortgage
$142,373
Interest Rate
4.87%
Mortgage Type
FHA
Purchase Details
Closed on
Aug 12, 2008
Sold by
Household Realty Corp
Bought by
Torres Jose M
Create a Home Valuation Report for This Property
The Home Valuation Report is an in-depth analysis detailing your home's value as well as a comparison with similar homes in the area
Home Values in the Area
Average Home Value in this Area
Purchase History
| Date | Buyer | Sale Price | Title Company |
|---|---|---|---|
| Torres Jose M | -- | Priority Title & Escrow | |
| Torres Jose M | -- | Fidelity Natl Title Ins Co | |
| Torres Jose M | -- | Old Republic Natl Title Ins | |
| Torres Jose M | $140,000 | -- |
Source: Public Records
Mortgage History
| Date | Status | Borrower | Loan Amount |
|---|---|---|---|
| Open | Torres Jose M | $147,800 | |
| Closed | Torres Jose M | $147,182 | |
| Closed | Torres Jose M | $142,373 |
Source: Public Records
Tax History Compared to Growth
Tax History
| Year | Tax Paid | Tax Assessment Tax Assessment Total Assessment is a certain percentage of the fair market value that is determined by local assessors to be the total taxable value of land and additions on the property. | Land | Improvement |
|---|---|---|---|---|
| 2025 | $1,786 | $53,110 | $9,629 | $43,481 |
| 2024 | $1,757 | $51,563 | $9,412 | $42,151 |
| 2023 | $1,757 | $50,061 | $9,218 | $40,843 |
| 2022 | $1,703 | $48,603 | $9,000 | $39,603 |
| 2021 | $1,688 | $47,188 | $9,000 | $38,188 |
| 2020 | $1,637 | $45,813 | $0 | $0 |
| 2019 | $1,598 | $44,479 | $0 | $0 |
| 2018 | $1,503 | $44,479 | $0 | $0 |
| 2017 | $1,878 | $55,774 | $0 | $0 |
| 2016 | $1,735 | $44,333 | $0 | $0 |
| 2014 | $1,677 | $44,333 | $0 | $0 |
| 2013 | -- | $44,333 | $6,340 | $37,993 |
Source: Public Records
Map
Nearby Homes
- 1330 Sage Brush Ct SE
- 565 Lisbon Ave SE
- 0 Ivory U11b2 Par Siesta Hillsii Rd SE Unit 11
- 549 Mindoro Dr SE
- 320 Tarpon Ave SE
- 9999 Tulip Rd SE
- 597 Bahama Dr SE
- 1013 12th St SE
- 1380 Spur Rd SE
- 1016 10th St SE
- 791 Archibeque Ave SE
- 1030 15th St SE
- 0 10th St NE Unit 12 1091043
- 1725 Geraldine Place SE
- 1145 Tulip Rd SE
- 1125 12th St SE
- 606 Inca Rd SE
- 1220 Villa Rd SE
- 1580 Glendale Ct SE
- 1151 Tulip Rd SE
- 1031 Cascade Rd SE
- 1031 Cascade Rr
- 1057 Cascade Rd SE
- 1029 Cascade Rd SE
- 1075 Cascade Rd SE
- 624 Ivory Rd SE
- 1076 Cascade Rd SE
- 1017 Cascade Rd SE
- 1123 Cascade Rd SE
- 1104 Cascade Rd SE
- 0 Ivory Rd SE
- 1032 Baltic Ave SE
- 1006 Arkansas St SE
- 1016 Cascade Rd SE Unit 11594
- 1024 Baltic Ave SE
- 1026 Baltic Ave SE
- 1016 Cascade Rd SE
- 1036 Baltic Ave SE
- 1076 Baltic Ave SE
- 1124 Cascade Rd SE