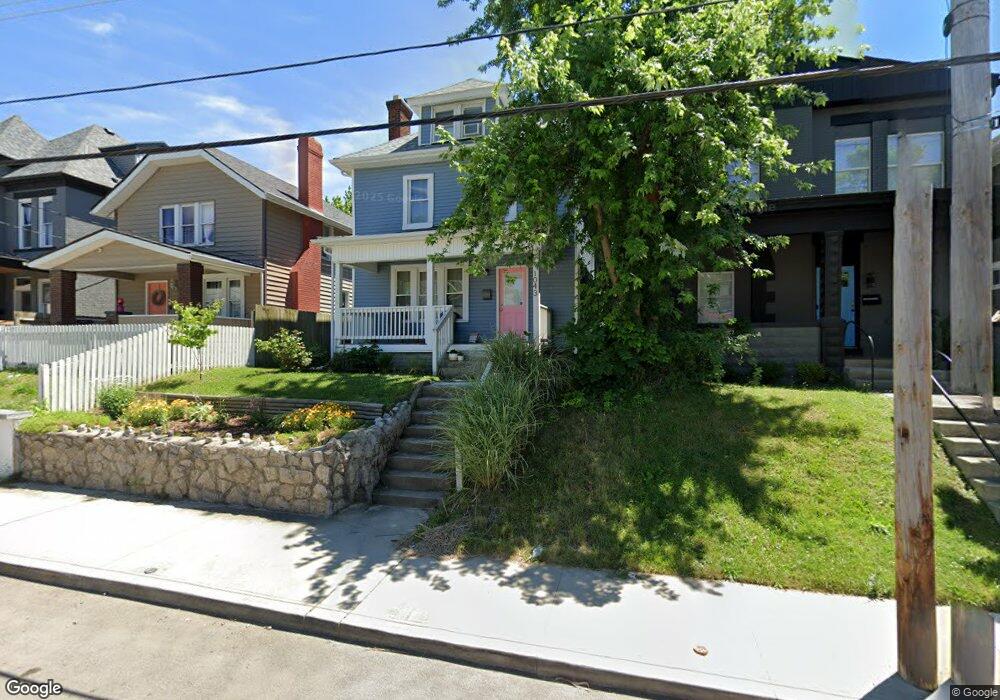
1043 E Whittier St Unit 1 Columbus, OH 43206
Karns Park NeighborhoodEstimated Value: $281,000 - $333,000
3
Beds
1
Bath
1,348
Sq Ft
$224/Sq Ft
Est. Value
About This Home
This home is located at 1043 E Whittier St Unit 1, Columbus, OH 43206 and is currently estimated at $302,506, approximately $224 per square foot. 1043 E Whittier St Unit 1 is a home located in Franklin County with nearby schools including Moler Elementary School, South High School, and Capital Collegiate Preparatory Academy.
Ownership History
Date
Name
Owned For
Owner Type
Purchase Details
Closed on
Aug 31, 2020
Sold by
614 Homes Llc
Bought by
Smith Andrew J and Smith Alyssa S
Current Estimated Value
Home Financials for this Owner
Home Financials are based on the most recent Mortgage that was taken out on this home.
Original Mortgage
$232,650
Outstanding Balance
$206,461
Interest Rate
2.9%
Mortgage Type
New Conventional
Estimated Equity
$96,045
Purchase Details
Closed on
Jan 22, 2020
Sold by
Garman Jean D
Bought by
614 Homes Llc
Home Financials for this Owner
Home Financials are based on the most recent Mortgage that was taken out on this home.
Original Mortgage
$139,990
Interest Rate
3.73%
Mortgage Type
Commercial
Purchase Details
Closed on
Aug 11, 1988
Bought by
Garman Gregory A and Garman Jean D
Create a Home Valuation Report for This Property
The Home Valuation Report is an in-depth analysis detailing your home's value as well as a comparison with similar homes in the area
Home Values in the Area
Average Home Value in this Area
Purchase History
| Date | Buyer | Sale Price | Title Company |
|---|---|---|---|
| Smith Andrew J | $258,500 | New Title Company Name | |
| 614 Homes Llc | $65,000 | Stewart Ttl Agcy Of Cols Ltd | |
| Garman Gregory A | $14,500 | -- |
Source: Public Records
Mortgage History
| Date | Status | Borrower | Loan Amount |
|---|---|---|---|
| Open | Smith Andrew J | $232,650 | |
| Previous Owner | 614 Homes Llc | $139,990 |
Source: Public Records
Tax History Compared to Growth
Tax History
| Year | Tax Paid | Tax Assessment Tax Assessment Total Assessment is a certain percentage of the fair market value that is determined by local assessors to be the total taxable value of land and additions on the property. | Land | Improvement |
|---|---|---|---|---|
| 2024 | $4,188 | $93,320 | $18,730 | $74,590 |
| 2023 | $4,135 | $93,310 | $18,725 | $74,585 |
| 2022 | $4,422 | $85,270 | $4,520 | $80,750 |
| 2021 | $4,430 | $85,270 | $4,520 | $80,750 |
| 2020 | $1,505 | $28,220 | $4,520 | $23,700 |
| 2019 | $1,321 | $21,250 | $3,470 | $17,780 |
| 2018 | $1,106 | $21,250 | $3,470 | $17,780 |
| 2017 | $1,150 | $21,250 | $3,470 | $17,780 |
| 2016 | $980 | $14,420 | $3,010 | $11,410 |
| 2015 | $892 | $14,420 | $3,010 | $11,410 |
| 2014 | $894 | $14,420 | $3,010 | $11,410 |
| 2013 | $464 | $15,155 | $3,150 | $12,005 |
Source: Public Records
Map
Nearby Homes
- 1100 Wilson Ave Unit 1100
- 1045 Wilson Ave Unit 47
- 1107 Stanley Ave
- 1154-1156 Wilson Ave
- 993 Oakwood Ave
- 1146 S Champion Ave Unit 1148
- 1144 E Whittier St
- 1060-1062 Linwood Ave
- 1170 S Champion Ave
- 943 S Champion Ave
- 1005 Studer Ave
- 883 E Whittier St
- 1068 E Deshler Ave
- 1196 S Ohio Ave
- 918 S Ohio Ave
- 1225-1227 S Champion Ave
- 900-902 Oakwood Ave
- 935 S Ohio Ave
- 931 S Ohio Ave
- 1025 Lockbourne Rd Unit 27
- 1043 E Whittier St
- 1041 E Whittier St
- 1041 1/2 E Whittier St
- 1049 E Whittier St
- 1049 Whitter
- 1037 E Whittier St
- 1053 E Whittier St
- 1057 E Whittier St
- 1031 E Whittier St
- 1061 E Whittier St
- 1052 E Whittier St
- 1025-1029 E Whittier St
- 1044 Reinhard Ave
- 1025 E Whittier St Unit 8
- 1025 E Whittier St Unit 29
- 1025 E Whittier St
- 1030 Reinhard Ave
- 1067 E Whittier St
- 1036 Reinhard Ave
- 1026 Reinhard Ave