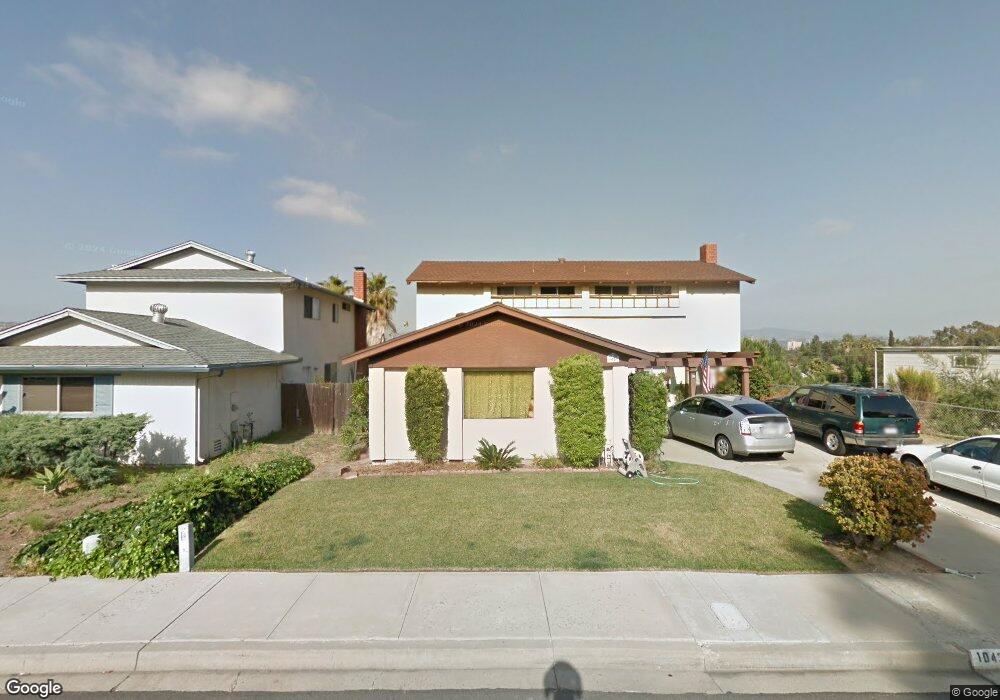
1043 Eastside Rd El Cajon, CA 92020
Fletcher Hills NeighborhoodEstimated Value: $915,682 - $1,293,000
3
Beds
3
Baths
1,884
Sq Ft
$583/Sq Ft
Est. Value
About This Home
This home is located at 1043 Eastside Rd, El Cajon, CA 92020 and is currently estimated at $1,098,921, approximately $583 per square foot. 1043 Eastside Rd is a home located in San Diego County with nearby schools including Flying Hills Elementary School, West Hills High School, and Grossmont Secondary School.
Ownership History
Date
Name
Owned For
Owner Type
Purchase Details
Closed on
Jun 11, 2021
Sold by
Saul David Lee
Bought by
Saul David L and David L Saul Living Trust
Current Estimated Value
Create a Home Valuation Report for This Property
The Home Valuation Report is an in-depth analysis detailing your home's value as well as a comparison with similar homes in the area
Home Values in the Area
Average Home Value in this Area
Purchase History
| Date | Buyer | Sale Price | Title Company |
|---|---|---|---|
| Saul David L | -- | None Available |
Source: Public Records
Tax History Compared to Growth
Tax History
| Year | Tax Paid | Tax Assessment Tax Assessment Total Assessment is a certain percentage of the fair market value that is determined by local assessors to be the total taxable value of land and additions on the property. | Land | Improvement |
|---|---|---|---|---|
| 2025 | $2,060 | $140,982 | $36,706 | $104,276 |
| 2024 | $2,060 | $138,219 | $35,987 | $102,232 |
| 2023 | $2,348 | $135,510 | $35,282 | $100,228 |
| 2022 | $2,328 | $132,854 | $34,591 | $98,263 |
| 2021 | $2,216 | $130,250 | $33,913 | $96,337 |
| 2020 | $2,177 | $128,916 | $33,566 | $95,350 |
| 2019 | $1,492 | $126,389 | $32,908 | $93,481 |
| 2018 | $1,467 | $123,912 | $32,263 | $91,649 |
| 2017 | $1,446 | $121,483 | $31,631 | $89,852 |
| 2016 | $1,387 | $119,102 | $31,011 | $88,091 |
| 2015 | $1,378 | $117,314 | $30,546 | $86,768 |
| 2014 | $1,351 | $115,017 | $29,948 | $85,069 |
Source: Public Records
Map
Nearby Homes
- 1340 Heron Ave
- 1677 Heron Ave
- 731 Dewane Dr
- 1387 Weers St
- 701 El Monte Rd
- 741 N Pierce St
- 0 Hacienda Dr
- 2052 Flying Hills Ln
- 1958 Milford Place
- 1673 Hillsmont Dr
- 2106 Windmill View Rd
- 1681 Hillsmont Dr
- 370 N Cuyamaca St
- 346 El Monte Rd
- 1498 Berenda Place
- 700 Wakefield Ct
- 589 N Johnson Ave Unit 247
- 589 N Johnson Ave Unit 130
- 2213 Chatham St
- 198 Croydon Ln
- 1025 Eastside Rd
- 1055 Eastside Rd
- 1034 Finch St
- 1077 Eastside Rd
- 1490 Partridge Ave
- 1012 Finch St
- 1034 Eastside Rd
- 1010 Finch St
- 1026 Eastside Rd
- 1076 Finch St
- 1103 Yerba Verde Dr
- 1089 Eastside Rd
- 1109 Yerba Verde Dr
- 1012 Eastside Rd
- 1088 Finch St
- 1101 Eastside Rd
- 1491 Partridge Ave
- 1000 Eastside Rd
- 1115 Yerba Verde Dr
- 1035 Finch St