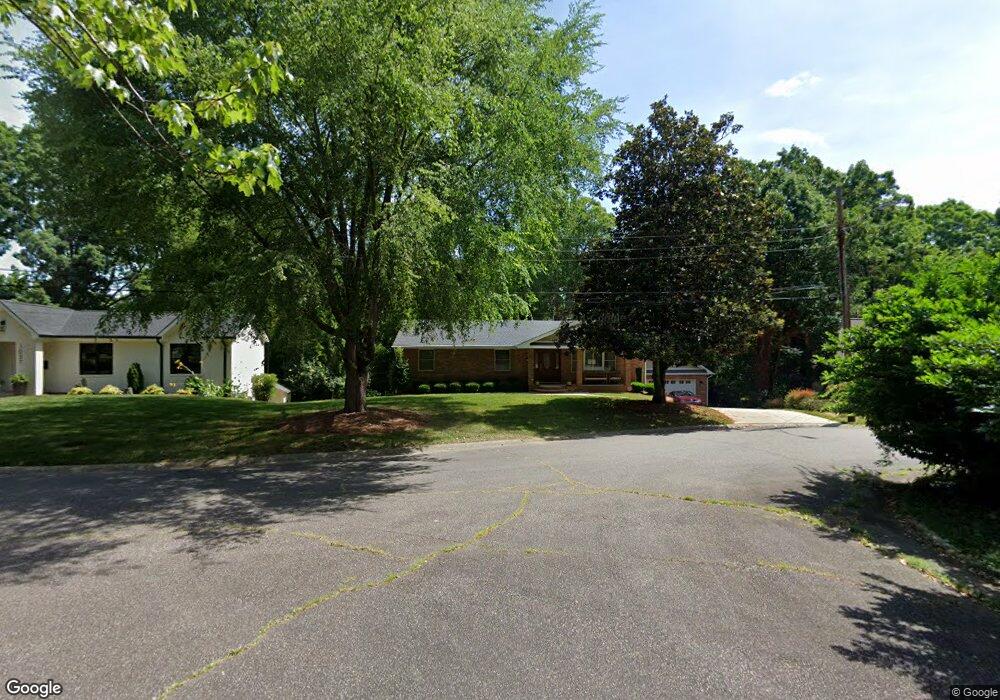
1043 Keystone Ct Charlotte, NC 28210
Madison Park NeighborhoodEstimated Value: $873,000 - $1,574,000
4
Beds
4
Baths
4,992
Sq Ft
$253/Sq Ft
Est. Value
About This Home
This home is located at 1043 Keystone Ct, Charlotte, NC 28210 and is currently estimated at $1,265,048, approximately $253 per square foot. 1043 Keystone Ct is a home located in Mecklenburg County with nearby schools including Pinewood Elementary, Alexander Graham Middle, and Myers Park High.
Ownership History
Date
Name
Owned For
Owner Type
Purchase Details
Closed on
Dec 20, 2024
Sold by
Lee Jeffrey
Bought by
Jeffrey Lee Living Trust and Lee
Current Estimated Value
Purchase Details
Closed on
Feb 10, 2020
Sold by
Lee Jeffrey S
Bought by
Lee Jeffrey Shen Jey and Lee Emily Elizabeth
Purchase Details
Closed on
Mar 26, 2013
Sold by
Lee Wayne Y and Lee Caroline C
Bought by
Lee Jeffrey S
Home Financials for this Owner
Home Financials are based on the most recent Mortgage that was taken out on this home.
Original Mortgage
$272,000
Interest Rate
3.57%
Mortgage Type
Future Advance Clause Open End Mortgage
Purchase Details
Closed on
Oct 21, 2011
Sold by
Jks Management Llc
Bought by
Lee Wayne Y and Lee Caroline C
Purchase Details
Closed on
Jan 1, 2004
Sold by
Lee Wayne Y and Lee Caroline C
Bought by
Jks Management Llc
Create a Home Valuation Report for This Property
The Home Valuation Report is an in-depth analysis detailing your home's value as well as a comparison with similar homes in the area
Home Values in the Area
Average Home Value in this Area
Purchase History
| Date | Buyer | Sale Price | Title Company |
|---|---|---|---|
| Jeffrey Lee Living Trust | -- | None Listed On Document | |
| Lee Jeffrey | -- | None Listed On Document | |
| Lee Jeffrey Shen Jey | -- | None Available | |
| Lee Jeffrey S | $340,000 | None Available | |
| Lee Wayne Y | -- | None Available | |
| Jks Management Llc | -- | -- |
Source: Public Records
Mortgage History
| Date | Status | Borrower | Loan Amount |
|---|---|---|---|
| Previous Owner | Lee Jeffrey S | $272,000 |
Source: Public Records
Tax History Compared to Growth
Tax History
| Year | Tax Paid | Tax Assessment Tax Assessment Total Assessment is a certain percentage of the fair market value that is determined by local assessors to be the total taxable value of land and additions on the property. | Land | Improvement |
|---|---|---|---|---|
| 2025 | $6,613 | $853,100 | $275,000 | $578,100 |
| 2024 | $6,613 | $853,100 | $275,000 | $578,100 |
| 2023 | $6,397 | $853,100 | $275,000 | $578,100 |
| 2022 | $5,450 | $551,800 | $190,000 | $361,800 |
| 2021 | $5,439 | $551,800 | $190,000 | $361,800 |
| 2020 | $5,432 | $551,800 | $190,000 | $361,800 |
| 2019 | $5,416 | $551,800 | $190,000 | $361,800 |
| 2018 | $5,594 | $420,800 | $100,000 | $320,800 |
| 2017 | $5,510 | $419,800 | $100,000 | $319,800 |
| 2016 | $5,500 | $420,800 | $100,000 | $320,800 |
| 2015 | $5,489 | $420,800 | $100,000 | $320,800 |
| 2014 | $5,467 | $420,800 | $100,000 | $320,800 |
Source: Public Records
Map
Nearby Homes
- 4910 Valley Stream Rd
- 2000 Tyvola Rd
- 1227 Barkley Rd
- 4600 Wedgewood Dr
- 5210 Valley Stream Rd
- 4918 Buckingham Dr
- 715 Fairbanks Rd
- 826 Montford Dr
- 4923 Park Rd Unit E
- 4923 Park Rd Unit A
- 4520 Bradbury Dr
- 1224 E Woodlawn Rd
- 1151 Kurt Ct
- 1703 Tyvola Rd
- 1437 Montford Dr
- 1105 Kurt Ct
- 5322 Chedworth Dr
- 1000 E Woodlawn Rd Unit 216
- 1000 E Woodlawn Rd Unit 113
- 1000 E Woodlawn Rd Unit 413
- 1049 Keystone Ct
- 1037 Keystone Ct
- 1031 Keystone Ct
- 1030 Keystone Ct Unit 3
- 1027 Keystone Ct
- 1118 Seneca Place
- 1024 Keystone Ct
- 1130 Seneca Place
- 1110 Seneca Place
- 1110 Seneca Place Unit 7
- 1021 Keystone Ct
- 1136 Seneca Place
- 1124 Seneca Place
- 1100 Seneca Place
- 1018 Keystone Ct
- 1013 Keystone Ct
- 1016 Seneca Place
- 1142 Seneca Place
- 1012 Keystone Ct
- 5100 Wedgewood Dr