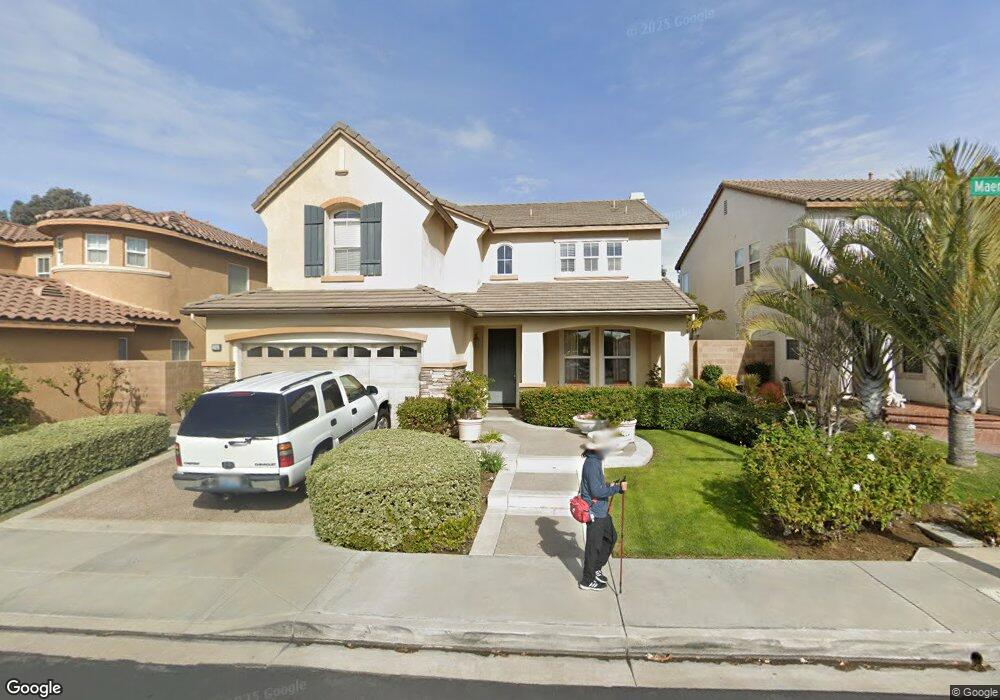
1043 Maertzweiler Dr Placentia, CA 92870
Estimated Value: $1,456,358 - $1,585,000
4
Beds
4
Baths
2,885
Sq Ft
$520/Sq Ft
Est. Value
About This Home
This home is located at 1043 Maertzweiler Dr, Placentia, CA 92870 and is currently estimated at $1,501,340, approximately $520 per square foot. 1043 Maertzweiler Dr is a home located in Orange County with nearby schools including John O. Tynes Elementary School, Kraemer Middle School, and Valencia High School.
Ownership History
Date
Name
Owned For
Owner Type
Purchase Details
Closed on
May 10, 2018
Sold by
Relph Michael and Relph Mary
Bought by
Relph Michael Leo and Relph Mary Helen
Current Estimated Value
Purchase Details
Closed on
Nov 23, 2010
Sold by
Relph Michael and Relph Mary
Bought by
Relph Michael and Relph Mary
Home Financials for this Owner
Home Financials are based on the most recent Mortgage that was taken out on this home.
Original Mortgage
$417,000
Outstanding Balance
$260,496
Interest Rate
3.25%
Mortgage Type
New Conventional
Estimated Equity
$1,240,844
Purchase Details
Closed on
Feb 22, 2006
Sold by
Relph Michael L and Relph Mary Helen
Bought by
Relph Michael and Relph Mary
Purchase Details
Closed on
Jul 30, 2002
Sold by
Hot Homes Areas 4 & 6 Lp
Bought by
Relph Michael L and Relph Mary Helen
Home Financials for this Owner
Home Financials are based on the most recent Mortgage that was taken out on this home.
Original Mortgage
$512,000
Interest Rate
6.6%
Create a Home Valuation Report for This Property
The Home Valuation Report is an in-depth analysis detailing your home's value as well as a comparison with similar homes in the area
Home Values in the Area
Average Home Value in this Area
Purchase History
| Date | Buyer | Sale Price | Title Company |
|---|---|---|---|
| Relph Michael Leo | -- | None Available | |
| Relph Michael | -- | Lsi | |
| Relph Michael | -- | None Available | |
| Relph Michael L | $640,000 | Lawyers Title |
Source: Public Records
Mortgage History
| Date | Status | Borrower | Loan Amount |
|---|---|---|---|
| Open | Relph Michael | $417,000 | |
| Closed | Relph Michael L | $512,000 | |
| Closed | Relph Michael L | $64,000 |
Source: Public Records
Tax History Compared to Growth
Tax History
| Year | Tax Paid | Tax Assessment Tax Assessment Total Assessment is a certain percentage of the fair market value that is determined by local assessors to be the total taxable value of land and additions on the property. | Land | Improvement |
|---|---|---|---|---|
| 2025 | $10,613 | $926,925 | $443,955 | $482,970 |
| 2024 | $10,613 | $908,750 | $435,250 | $473,500 |
| 2023 | $10,411 | $890,932 | $426,716 | $464,216 |
| 2022 | $10,289 | $873,463 | $418,349 | $455,114 |
| 2021 | $10,070 | $856,337 | $410,146 | $446,191 |
| 2020 | $10,101 | $847,557 | $405,941 | $441,616 |
| 2019 | $9,714 | $830,939 | $397,982 | $432,957 |
| 2018 | $9,592 | $814,647 | $390,179 | $424,468 |
| 2017 | $9,434 | $798,674 | $382,528 | $416,146 |
| 2016 | $9,246 | $783,014 | $375,027 | $407,987 |
| 2015 | $9,132 | $771,253 | $369,394 | $401,859 |
| 2014 | $8,871 | $756,146 | $362,158 | $393,988 |
Source: Public Records
Map
Nearby Homes
- 988 Spyglass Place
- 615 Jensen Place
- 1142 Soto Place
- 1037 Davis Way
- 747 De Jesus Dr
- 1171 Curie Ln
- 1259 E Providence Loop
- 625 Patten Ave
- Elina Plan at Vista Rose
- Lyda Plan at Vista Rose
- Prairie Plan at Vista Rose
- Gallica Plan at Vista Rose
- 653 Patten Ave
- 707 Olivier Dr
- 582 Mcfadden St
- 704 Mcfadden St
- 714 Olivier Dr
- 718 Olivier Dr
- 549 Fordham Dr
- 727 Olivier Dr
- 1037 Maertzweiler Dr
- 1049 Maertzweiler Dr
- 1031 Maertzweiler Dr
- 1055 Maertzweiler Dr
- 1042 Maertzweiler Dr
- 1048 Maertzweiler Dr
- 1036 Maertzweiler Dr
- 1025 Maertzweiler Dr
- 1061 Maertzweiler Dr
- 1030 Maertzweiler Dr
- 1054 Maertzweiler Dr
- 415 Black Ln
- 1019 Maertzweiler Dr
- 1067 Maertzweiler Dr
- 1024 Maertzweiler Dr
- 1060 Maertzweiler Dr
- 414 Black Ln
- 418 Cline Ct
- 409 Black Ln
- 1013 Maertzweiler Dr