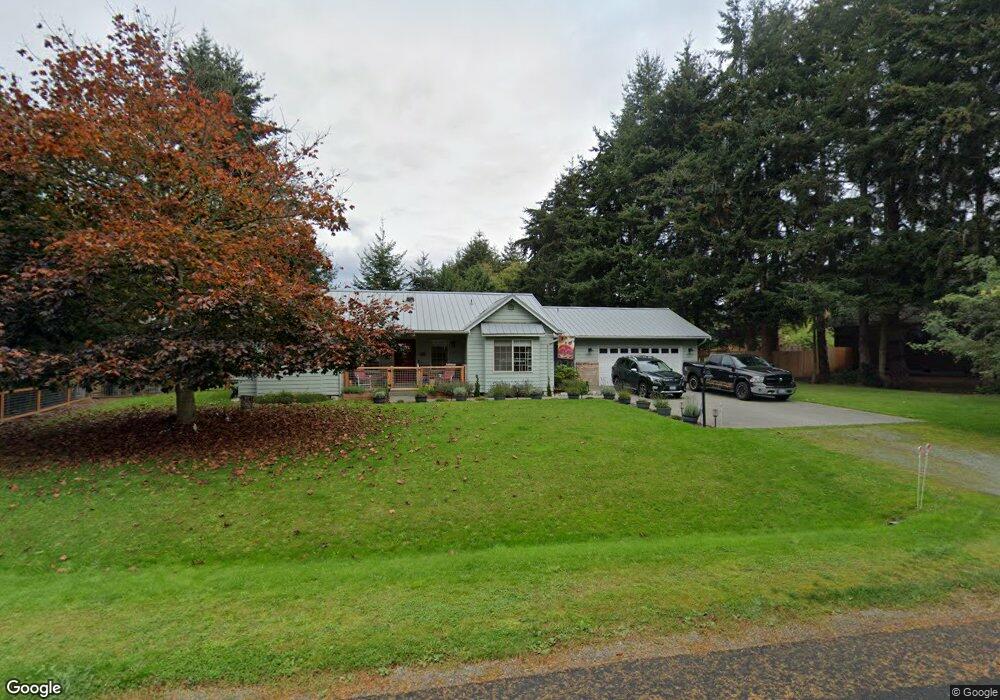
1043 Pennington Loop NE Coupeville, WA 98239
Estimated Value: $697,609 - $783,000
3
Beds
3
Baths
2,033
Sq Ft
$367/Sq Ft
Est. Value
About This Home
This home is located at 1043 Pennington Loop NE, Coupeville, WA 98239 and is currently estimated at $745,152, approximately $366 per square foot. 1043 Pennington Loop NE is a home located in Island County with nearby schools including Coupeville Elementary School, Coupeville Middle School, and Coupeville High School.
Ownership History
Date
Name
Owned For
Owner Type
Purchase Details
Closed on
Aug 13, 2025
Sold by
Rocha Fredrick Nicholas Perry and Rocha Kimberly
Bought by
Richling Rachel and Richling Maxwell
Current Estimated Value
Home Financials for this Owner
Home Financials are based on the most recent Mortgage that was taken out on this home.
Original Mortgage
$601,000
Outstanding Balance
$599,956
Interest Rate
6.72%
Mortgage Type
New Conventional
Estimated Equity
$145,196
Purchase Details
Closed on
Sep 7, 2021
Sold by
Box Christopher Lawrence Allen and Box Heather
Bought by
Rocha Frederick Nicholas Perry and Rocha Kimberly Kay
Home Financials for this Owner
Home Financials are based on the most recent Mortgage that was taken out on this home.
Original Mortgage
$520,000
Interest Rate
2.8%
Mortgage Type
New Conventional
Purchase Details
Closed on
Nov 14, 2019
Sold by
Yuska Margaret E
Bought by
Allen Box Christopher Lawrence and Box Heather
Home Financials for this Owner
Home Financials are based on the most recent Mortgage that was taken out on this home.
Original Mortgage
$433,860
Interest Rate
3.65%
Mortgage Type
VA
Create a Home Valuation Report for This Property
The Home Valuation Report is an in-depth analysis detailing your home's value as well as a comparison with similar homes in the area
Home Values in the Area
Average Home Value in this Area
Purchase History
| Date | Buyer | Sale Price | Title Company |
|---|---|---|---|
| Richling Rachel | $776,000 | Chicago Title | |
| Rocha Frederick Nicholas Perry | $650,000 | Premier Title | |
| Allen Box Christopher Lawrence | $420,000 | Chicago Title Company Of Wa |
Source: Public Records
Mortgage History
| Date | Status | Borrower | Loan Amount |
|---|---|---|---|
| Open | Richling Rachel | $601,000 | |
| Previous Owner | Rocha Frederick Nicholas Perry | $520,000 | |
| Previous Owner | Allen Box Christopher Lawrence | $433,860 |
Source: Public Records
Tax History Compared to Growth
Tax History
| Year | Tax Paid | Tax Assessment Tax Assessment Total Assessment is a certain percentage of the fair market value that is determined by local assessors to be the total taxable value of land and additions on the property. | Land | Improvement |
|---|---|---|---|---|
| 2025 | $4,288 | $620,062 | $240,000 | $380,062 |
| 2024 | $4,667 | $577,842 | $225,000 | $352,842 |
| 2023 | $4,667 | $566,933 | $210,000 | $356,933 |
| 2022 | $3,990 | $526,911 | $200,000 | $326,911 |
| 2021 | $3,537 | $418,153 | $150,000 | $268,153 |
| 2020 | $3,317 | $391,498 | $130,000 | $261,498 |
| 2019 | $3,035 | $360,088 | $170,000 | $190,088 |
| 2018 | $3,244 | $318,819 | $150,000 | $168,819 |
| 2017 | $2,871 | $299,992 | $130,000 | $169,992 |
| 2016 | $2,761 | $287,353 | $115,000 | $172,353 |
| 2015 | -- | $264,714 | $90,000 | $174,714 |
| 2013 | -- | $264,436 | $85,000 | $179,436 |
Source: Public Records
Map
Nearby Homes
- 1003 NE Summit Loop
- 703 NE 6th St
- 980 NE Pennington Loop
- 404 NE 4th St
- 904 NE Lindsay St Unit 201
- 501 NE 9th St
- 505 Kinney St NE
- 401 NE 9th St
- 1204 NE Leisure St
- 506 N Main St
- 602 N Main St
- 807 N Main St
- 0 NW Front St Unit 1669999
- 306 S Main St Unit A1
- 701 S Main St Unit 1
- 125 Parker Wood Ln
- 311 N Rosewood Ct
- 635 Indian Hill Rd
- 670 Indian Hill Rd
- 305 Alta Vista Ave
- 1035 NE Pennington Loop
- 1049 NE Pennington Loop
- 1030 NE Summit Loop
- 1014 NE Summit Loop
- 1038 NE Summit Loop
- 1048 NE Pennington Loop
- 1034 NE Pennington Loop
- 1034 NE Pennington Loop
- 1044 NE Pennington Loop
- 1012 NE Summit Loop
- 1010 NE Summit Loop
- 1040 NE Pennington Loop
- 1057 Pennington Loop NE
- 0 LOT 6 NE Summit Loop
- 0 XXX NE Summit Loop
- 1054 NE Pennington Loop
- 1040 NE Summit Loop
- 1030 NE Pennington Loop