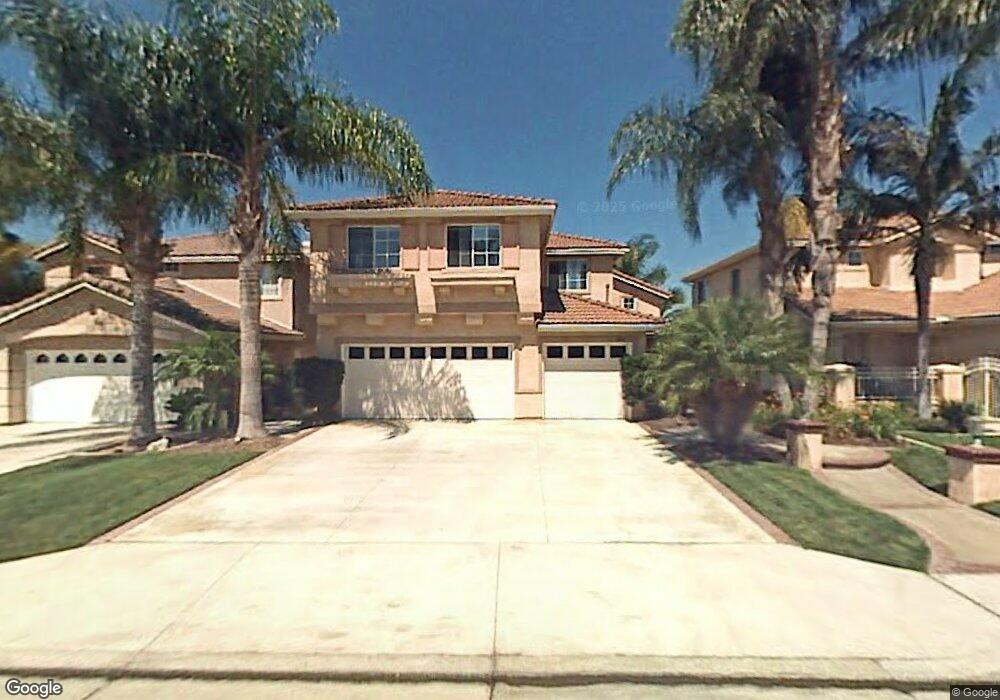
1043 S Matthew Way Anaheim, CA 92808
Anaheim Hills NeighborhoodEstimated Value: $1,542,043 - $1,926,000
4
Beds
3
Baths
2,661
Sq Ft
$636/Sq Ft
Est. Value
About This Home
This home is located at 1043 S Matthew Way, Anaheim, CA 92808 and is currently estimated at $1,692,011, approximately $635 per square foot. 1043 S Matthew Way is a home located in Orange County with nearby schools including Canyon Rim Elementary, Canyon High School, and El Rancho Charter.
Ownership History
Date
Name
Owned For
Owner Type
Purchase Details
Closed on
Dec 12, 2009
Sold by
Sahba Kyan and Sahba Kamram
Bought by
Sahba Kamran and Matthew Trust
Current Estimated Value
Purchase Details
Closed on
Feb 27, 2008
Sold by
Kwon Chung
Bought by
Sahba Kyan and Sahba Kamran
Purchase Details
Closed on
Nov 5, 1999
Sold by
Richard Armstrong
Bought by
Kwon Inwon and Kwon Chung
Purchase Details
Closed on
Apr 29, 1996
Sold by
Armstrong Richard
Bought by
Armstrong Richard and Richard B Armstrong 1991 Living Trust
Purchase Details
Closed on
Oct 20, 1995
Sold by
Presley Homes
Bought by
Armstrong Richard
Home Financials for this Owner
Home Financials are based on the most recent Mortgage that was taken out on this home.
Original Mortgage
$207,000
Interest Rate
7.1%
Create a Home Valuation Report for This Property
The Home Valuation Report is an in-depth analysis detailing your home's value as well as a comparison with similar homes in the area
Home Values in the Area
Average Home Value in this Area
Purchase History
| Date | Buyer | Sale Price | Title Company |
|---|---|---|---|
| Sahba Kamran | -- | None Available | |
| Sahba Kyan | $735,000 | Orange Coast Title | |
| Kwon Inwon | $420,000 | Orange Coast Title | |
| Armstrong Richard | -- | -- | |
| Armstrong Richard | $292,000 | First American Title Ins |
Source: Public Records
Mortgage History
| Date | Status | Borrower | Loan Amount |
|---|---|---|---|
| Previous Owner | Armstrong Richard | $207,000 |
Source: Public Records
Tax History Compared to Growth
Tax History
| Year | Tax Paid | Tax Assessment Tax Assessment Total Assessment is a certain percentage of the fair market value that is determined by local assessors to be the total taxable value of land and additions on the property. | Land | Improvement |
|---|---|---|---|---|
| 2025 | $9,993 | $933,427 | $511,216 | $422,211 |
| 2024 | $9,993 | $915,125 | $501,192 | $413,933 |
| 2023 | $9,773 | $897,182 | $491,365 | $405,817 |
| 2022 | $9,584 | $879,591 | $481,731 | $397,860 |
| 2021 | $9,313 | $862,345 | $472,286 | $390,059 |
| 2020 | $9,227 | $853,503 | $467,443 | $386,060 |
| 2019 | $9,108 | $836,768 | $458,277 | $378,491 |
| 2018 | $8,967 | $820,361 | $449,291 | $371,070 |
| 2017 | $8,589 | $804,276 | $440,481 | $363,795 |
| 2016 | $8,421 | $788,506 | $431,844 | $356,662 |
| 2015 | $8,242 | $776,662 | $425,357 | $351,305 |
| 2014 | $7,964 | $745,000 | $417,025 | $327,975 |
Source: Public Records
Map
Nearby Homes
- 7572 E Endemont Ct
- 7750 E Portofino Ave
- 823 S Cottontail Ln
- 7912 E Monte Carlo Ave
- 760 S Thrasher Way
- 7859 E Quinn Dr
- 712 S Lost Canyon Rd
- 414 S Cooks Corner
- 7921 E Quinn Dr
- 7939 E Quinn Dr
- 7847 E Margaret Ct
- 7917 E Viewrim Dr
- 719 S Goldfinch Way
- 7653 E Corto Rd
- 950 S Rim Crest Dr Unit 12
- 1082 S Rossano Way
- 1062 S Romano Ct
- 8027 E Naples Ln
- 7239 E Drake Dr
- 8025 E Sandstone Dr
- 1037 S Matthew Way
- 1051 S Matthew Way
- 1031 S Matthew Way
- 1055 S Matthew Way
- 1023 S Matthew Way
- 1061 S Matthew Way
- 1054 S Matthew Way
- 1062 S Matthew Way
- 1046 S Matthew Way
- 1038 S Matthew Way
- 997 S Matthew Way
- 1070 S Matthew Way Unit 34
- 1030 S Matthew Way
- 989 S Matthew Way
- 1075 S Matthew Way
- 1024 S Matthew Way
- 7527 E Moonridge Ln
- 7533 E Moonridge Ln
- 7521 E Moonridge Ln
- 7539 E Moonridge Ln