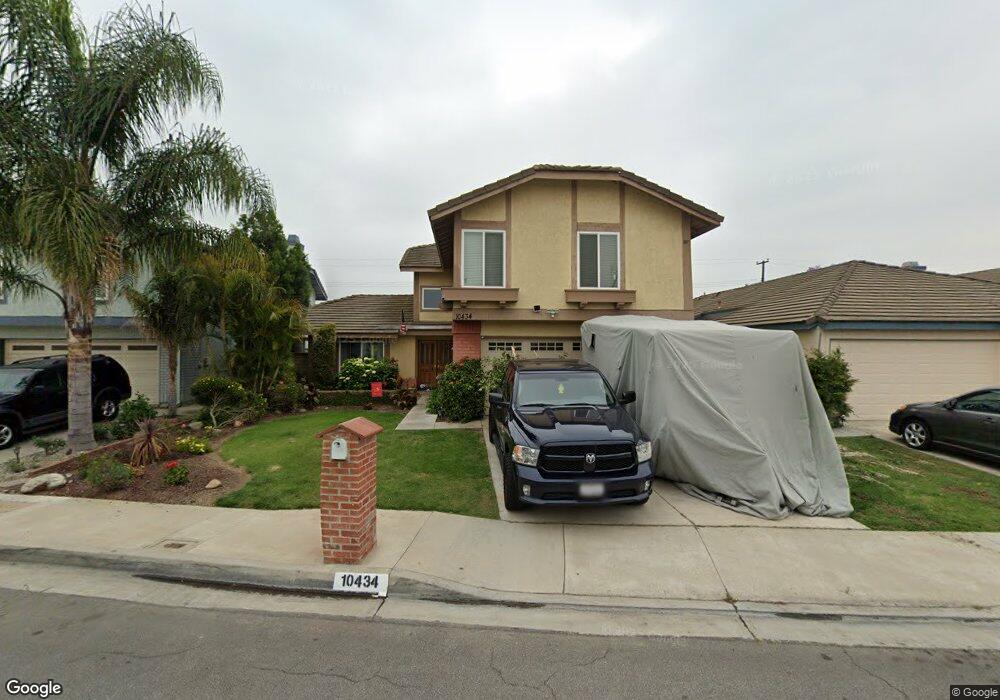
10434 Parise Dr Whittier, CA 90604
South Whittier NeighborhoodEstimated Value: $914,000 - $1,082,000
4
Beds
3
Baths
2,210
Sq Ft
$458/Sq Ft
Est. Value
About This Home
This home is located at 10434 Parise Dr, Whittier, CA 90604 and is currently estimated at $1,012,382, approximately $458 per square foot. 10434 Parise Dr is a home located in Los Angeles County with nearby schools including La Colima Elementary School, Hillview Middle School, and California High School.
Ownership History
Date
Name
Owned For
Owner Type
Purchase Details
Closed on
May 28, 2014
Sold by
Kirkland Gale M and Kirkland Kenton J
Bought by
Kirkland Bradley and Kirkland Shibon
Current Estimated Value
Home Financials for this Owner
Home Financials are based on the most recent Mortgage that was taken out on this home.
Original Mortgage
$416,500
Outstanding Balance
$315,482
Interest Rate
4.09%
Mortgage Type
New Conventional
Estimated Equity
$696,900
Purchase Details
Closed on
May 22, 2001
Sold by
Kirkland Kenton J and Kirkland Gale M
Bought by
Kirkland Kenton J and Kirkland Gale M
Home Financials for this Owner
Home Financials are based on the most recent Mortgage that was taken out on this home.
Original Mortgage
$247,000
Interest Rate
7.14%
Purchase Details
Closed on
May 21, 1997
Sold by
Kirkland Kent and Kirkland Gale
Bought by
Kirkland Kenton J and Kirkland Gale M
Create a Home Valuation Report for This Property
The Home Valuation Report is an in-depth analysis detailing your home's value as well as a comparison with similar homes in the area
Home Values in the Area
Average Home Value in this Area
Purchase History
| Date | Buyer | Sale Price | Title Company |
|---|---|---|---|
| Kirkland Bradley | $520,000 | Lawyers Title | |
| Kirkland Kenton J | -- | Benefit Land Title Company | |
| Kirkland Kenton J | -- | -- |
Source: Public Records
Mortgage History
| Date | Status | Borrower | Loan Amount |
|---|---|---|---|
| Open | Kirkland Bradley | $416,500 | |
| Previous Owner | Kirkland Kenton J | $247,000 |
Source: Public Records
Tax History Compared to Growth
Tax History
| Year | Tax Paid | Tax Assessment Tax Assessment Total Assessment is a certain percentage of the fair market value that is determined by local assessors to be the total taxable value of land and additions on the property. | Land | Improvement |
|---|---|---|---|---|
| 2025 | $7,490 | $624,952 | $352,017 | $272,935 |
| 2024 | $7,490 | $612,699 | $345,115 | $267,584 |
| 2023 | $7,362 | $600,687 | $338,349 | $262,338 |
| 2022 | $7,203 | $588,910 | $331,715 | $257,195 |
| 2021 | $7,058 | $577,363 | $325,211 | $252,152 |
| 2019 | $6,918 | $560,240 | $315,566 | $244,674 |
| 2018 | $6,694 | $549,256 | $309,379 | $239,877 |
| 2016 | $6,334 | $527,929 | $297,366 | $230,563 |
| 2015 | $6,296 | $520,000 | $292,900 | $227,100 |
| 2014 | $5,299 | $435,955 | $173,909 | $262,046 |
Source: Public Records
Map
Nearby Homes
- 10415 Valley View Ave
- 10347 Corley Dr
- 14520 Mulberry Dr
- 14816 Lanning Dr
- 10702 Colima Rd Unit 1005
- 10700 Colima Rd Unit 914
- 14518 Rimgate Dr
- 14851 Mulberry Dr Unit 114
- 10431 Memphis Ave
- 14865 Mulberry Dr Unit 1101
- 10523 Memphis Ave
- 10855 Colima Rd
- 10802 Archway Dr
- 10241 Ruoff Ave
- 10847 La Mirada Blvd
- 14532 Anola St
- 15112 Flomar Dr
- 9234 Mills Ave
- 14539 Cullen St
- 11111 Colima Rd
- 10440 Parise Dr
- 10430 Parise Dr
- 10444 Parise Dr
- 10424 Parise Dr
- 10419 Valley View Ave
- 10425 Valley View Ave
- 10431 Valley View Ave
- 10450 Parise Dr
- 10420 Parise Dr
- 10409 Valley View Ave
- 10435 Valley View Ave
- 10435 Parise Dr
- 10431 Parise Dr
- 10454 Parise Dr
- 10441 Parise Dr
- 10414 Parise Dr
- 10425 Parise Dr
- 10405 Valley View Ave
- 10445 Parise Dr
- 10439 Valley View Ave