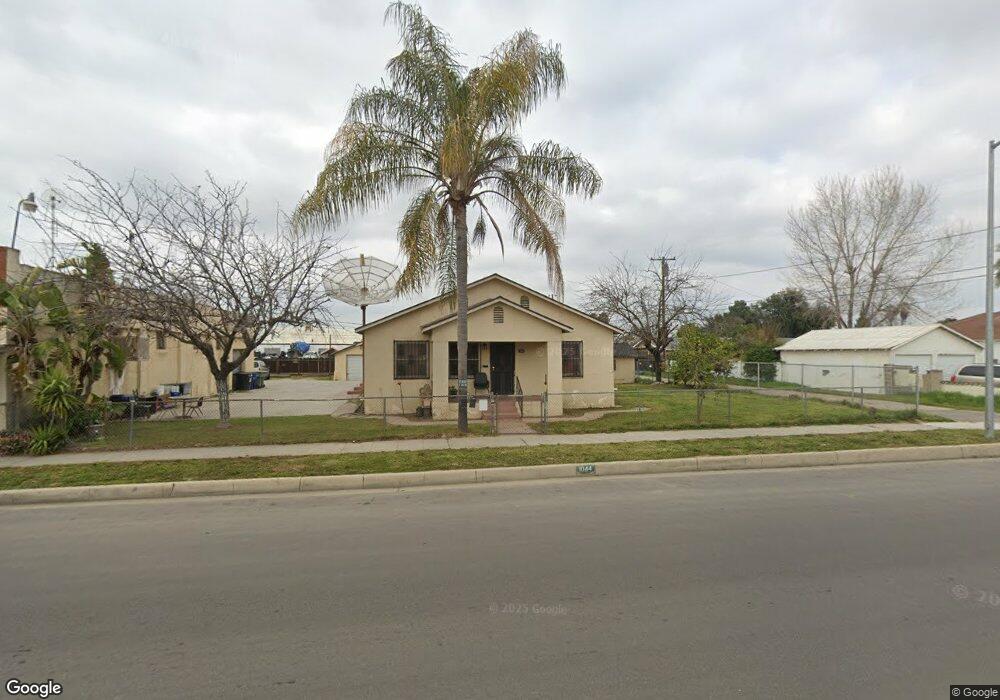
1044 8th St Sanger, CA 93657
Estimated Value: $247,222 - $313,000
3
Beds
1
Bath
1,280
Sq Ft
$213/Sq Ft
Est. Value
About This Home
This home is located at 1044 8th St, Sanger, CA 93657 and is currently estimated at $272,074, approximately $212 per square foot. 1044 8th St is a home located in Fresno County with nearby schools including Wilson Elementary School, Washington Academic Middle School, and Sanger High School.
Ownership History
Date
Name
Owned For
Owner Type
Purchase Details
Closed on
Nov 2, 2001
Sold by
Cantu Maria
Bought by
Cantu Maria
Current Estimated Value
Purchase Details
Closed on
Feb 16, 2001
Sold by
Cantu Everardo
Bought by
Cantu Maria
Purchase Details
Closed on
Aug 22, 1995
Sold by
Lascano Isabel
Bought by
Cantu Everardo and Cantu Maria Delossantos
Purchase Details
Closed on
Oct 5, 1994
Sold by
Perez Frank A and Perez Amelia
Bought by
Cantu Everardo and Cantu Maria Delossantos
Create a Home Valuation Report for This Property
The Home Valuation Report is an in-depth analysis detailing your home's value as well as a comparison with similar homes in the area
Home Values in the Area
Average Home Value in this Area
Purchase History
| Date | Buyer | Sale Price | Title Company |
|---|---|---|---|
| Cantu Maria | -- | -- | |
| Cantu Maria | -- | -- | |
| Cantu Maria | -- | -- | |
| Cantu Everardo | $20,000 | Chicago Title Co | |
| Cantu Everardo | $25,000 | Chicago Title Company |
Source: Public Records
Tax History
| Year | Tax Paid | Tax Assessment Tax Assessment Total Assessment is a certain percentage of the fair market value that is determined by local assessors to be the total taxable value of land and additions on the property. | Land | Improvement |
|---|---|---|---|---|
| 2025 | $551 | $41,522 | $5,972 | $35,550 |
| 2023 | $518 | $39,911 | $5,741 | $34,170 |
| 2022 | $510 | $39,129 | $5,629 | $33,500 |
| 2021 | $506 | $38,363 | $5,519 | $32,844 |
| 2020 | $492 | $37,971 | $5,463 | $32,508 |
| 2019 | $483 | $37,227 | $5,356 | $31,871 |
| 2018 | $464 | $36,498 | $5,251 | $31,247 |
| 2017 | $456 | $35,784 | $5,149 | $30,635 |
| 2016 | $430 | $35,084 | $5,049 | $30,035 |
| 2015 | $434 | $34,558 | $4,974 | $29,584 |
| 2014 | $428 | $33,882 | $4,877 | $29,005 |
Source: Public Records
Map
Nearby Homes
Your Personal Tour Guide
Ask me questions while you tour the home.