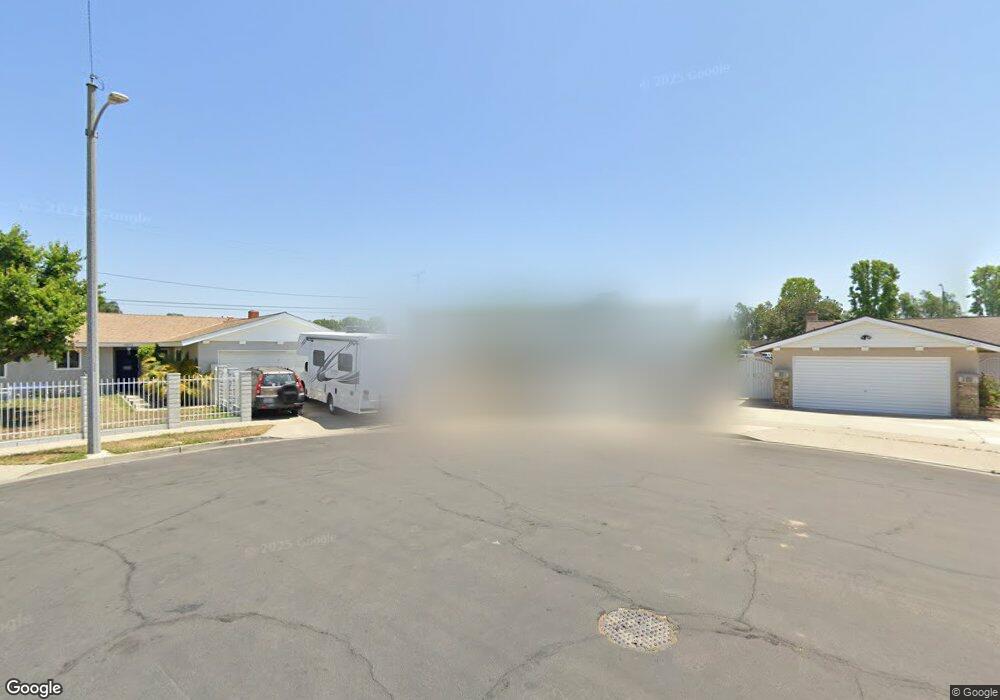
10442 Luders Ave Garden Grove, CA 92843
Estimated Value: $1,010,536 - $1,146,000
4
Beds
2
Baths
1,516
Sq Ft
$711/Sq Ft
Est. Value
About This Home
This home is located at 10442 Luders Ave, Garden Grove, CA 92843 and is currently estimated at $1,077,884, approximately $711 per square foot. 10442 Luders Ave is a home located in Orange County with nearby schools including Mitchell Elementary School, Donald S. Jordan Intermediate School, and Garden Grove High School.
Ownership History
Date
Name
Owned For
Owner Type
Purchase Details
Closed on
Feb 3, 2020
Sold by
Pham Lanthy Ngo
Bought by
Ngo Dat Quang
Current Estimated Value
Home Financials for this Owner
Home Financials are based on the most recent Mortgage that was taken out on this home.
Original Mortgage
$373,000
Outstanding Balance
$331,015
Interest Rate
3.72%
Mortgage Type
New Conventional
Estimated Equity
$746,869
Purchase Details
Closed on
May 16, 2014
Sold by
Pham Lanthy Ngo
Bought by
Pham Lanthy Ngo and Ngo Dat Quang
Purchase Details
Closed on
Jul 16, 2001
Sold by
Pham The Nhu
Bought by
Pham Lanthy Ngo
Home Financials for this Owner
Home Financials are based on the most recent Mortgage that was taken out on this home.
Original Mortgage
$80,000
Interest Rate
7.21%
Purchase Details
Closed on
Aug 30, 1999
Sold by
Ngo Peter
Bought by
Pham Lanthy Ngo
Purchase Details
Closed on
Jun 13, 1997
Sold by
Pham The Nhu and Ngo Lanthy Ngo
Bought by
Ngo Peter
Create a Home Valuation Report for This Property
The Home Valuation Report is an in-depth analysis detailing your home's value as well as a comparison with similar homes in the area
Home Values in the Area
Average Home Value in this Area
Purchase History
| Date | Buyer | Sale Price | Title Company |
|---|---|---|---|
| Ngo Dat Quang | -- | Navy Federal Title Of Ca Inc | |
| Pham Lanthy Ngo | -- | None Available | |
| Pham Lanthy Ngo | -- | Stewart Title | |
| Pham Lanthy Ngo | -- | Commonwealth Land Title Co | |
| Ngo Peter | -- | -- |
Source: Public Records
Mortgage History
| Date | Status | Borrower | Loan Amount |
|---|---|---|---|
| Open | Ngo Dat Quang | $373,000 | |
| Previous Owner | Pham Lanthy Ngo | $80,000 |
Source: Public Records
Tax History Compared to Growth
Tax History
| Year | Tax Paid | Tax Assessment Tax Assessment Total Assessment is a certain percentage of the fair market value that is determined by local assessors to be the total taxable value of land and additions on the property. | Land | Improvement |
|---|---|---|---|---|
| 2025 | $2,261 | $331,495 | $246,005 | $85,490 |
| 2024 | $2,261 | $324,996 | $241,182 | $83,814 |
| 2023 | $4,178 | $318,624 | $236,453 | $82,171 |
| 2022 | $4,089 | $312,377 | $231,817 | $80,560 |
| 2021 | $4,046 | $306,252 | $227,271 | $78,981 |
| 2020 | $3,910 | $303,112 | $224,940 | $78,172 |
| 2019 | $3,836 | $297,169 | $220,529 | $76,640 |
| 2018 | $3,759 | $291,343 | $216,205 | $75,138 |
| 2017 | $3,706 | $285,631 | $211,966 | $73,665 |
| 2016 | $3,527 | $280,031 | $207,810 | $72,221 |
| 2015 | $3,477 | $275,825 | $204,688 | $71,137 |
| 2014 | $3,392 | $270,422 | $200,678 | $69,744 |
Source: Public Records
Map
Nearby Homes
- 13372 Jessica Dr
- 10391 Mildred Ave
- 10422 Bonnie Dr
- 13161 Adland St
- 13312 Michael Rainford Cir
- 10094 Larson Ave
- 10002 Central Ave Unit 27
- 10002 Central Ave
- 10401 W Garden Grove Blvd Unit 53
- 10361 Garden Grove Blvd Unit 30
- 9931 Central Ave
- 10371 Garden Grove Blvd Unit 16
- 10371 Garden Grove Blvd Unit 20
- 10866 Westminster Ave Unit 10
- 10866 Westminster Ave Unit 1
- 14151 Lake St
- 10061 15th St
- 10541 Lakeside Dr S Unit P
- 10521 Lakeside Dr S Unit I
- 14171 Flower St Unit 13
- 10422 Luders Ave
- 10452 Luders Ave
- 13471 Benton St
- 13451 Benton St
- 13441 Benton St
- 10412 Luders Ave
- 10441 Luders Ave
- 13431 Benton St Unit 2
- 13431 Benton St Unit BACK HOUSE
- 13431 Benton St
- 10421 Luders Ave
- 10402 Luders Ave
- 10411 Luders Ave
- 13411 Benton St
- 10401 Luders Ave
- 10392 Luders Ave
- 13472 Benton St
- 13462 Benton St
- 10422 Dakota Ave
- 10442 Dakota Ave