10443 Osage Rd Waterloo, IA 50703
Estimated Value: $190,000 - $267,000
3
Beds
1
Bath
1,232
Sq Ft
$192/Sq Ft
Est. Value
About This Home
This home is located at 10443 Osage Rd, Waterloo, IA 50703 and is currently estimated at $236,398, approximately $191 per square foot. 10443 Osage Rd is a home located in Black Hawk County with nearby schools including Jesup Elementary School, Jesup Middle School, and Jesup High School.
Ownership History
Date
Name
Owned For
Owner Type
Purchase Details
Closed on
Aug 21, 2009
Sold by
Rottinghaus Richard J and Rottinghaus Ramona M
Bought by
Rottinghaus Eric M and Rottinghaus Trela A
Current Estimated Value
Home Financials for this Owner
Home Financials are based on the most recent Mortgage that was taken out on this home.
Original Mortgage
$93,353
Interest Rate
5.28%
Mortgage Type
New Conventional
Create a Home Valuation Report for This Property
The Home Valuation Report is an in-depth analysis detailing your home's value as well as a comparison with similar homes in the area
Home Values in the Area
Average Home Value in this Area
Purchase History
| Date | Buyer | Sale Price | Title Company |
|---|---|---|---|
| Rottinghaus Eric M | $104,000 | Black Hawk County Abstract |
Source: Public Records
Mortgage History
| Date | Status | Borrower | Loan Amount |
|---|---|---|---|
| Closed | Rottinghaus Eric M | $93,353 |
Source: Public Records
Tax History Compared to Growth
Tax History
| Year | Tax Paid | Tax Assessment Tax Assessment Total Assessment is a certain percentage of the fair market value that is determined by local assessors to be the total taxable value of land and additions on the property. | Land | Improvement |
|---|---|---|---|---|
| 2024 | $2,564 | $204,870 | $60,000 | $144,870 |
| 2023 | $2,188 | $204,870 | $60,000 | $144,870 |
| 2022 | $2,140 | $153,820 | $48,000 | $105,820 |
| 2021 | $2,132 | $153,820 | $48,000 | $105,820 |
| 2020 | $2,116 | $144,820 | $39,000 | $105,820 |
| 2019 | $2,116 | $144,820 | $39,000 | $105,820 |
| 2018 | $2,146 | $144,820 | $39,000 | $105,820 |
| 2017 | $2,092 | $144,820 | $39,000 | $105,820 |
| 2016 | $2,020 | $144,820 | $39,000 | $105,820 |
| 2015 | $2,020 | $144,820 | $39,000 | $105,820 |
| 2014 | $2,052 | $144,820 | $39,000 | $105,820 |
Source: Public Records
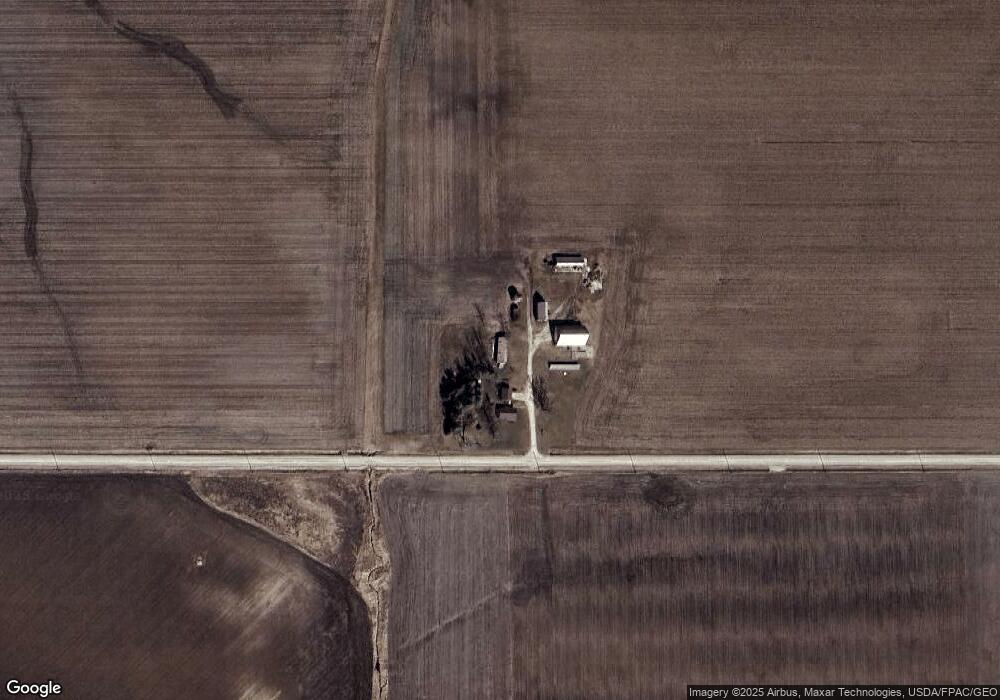
Map
Nearby Homes