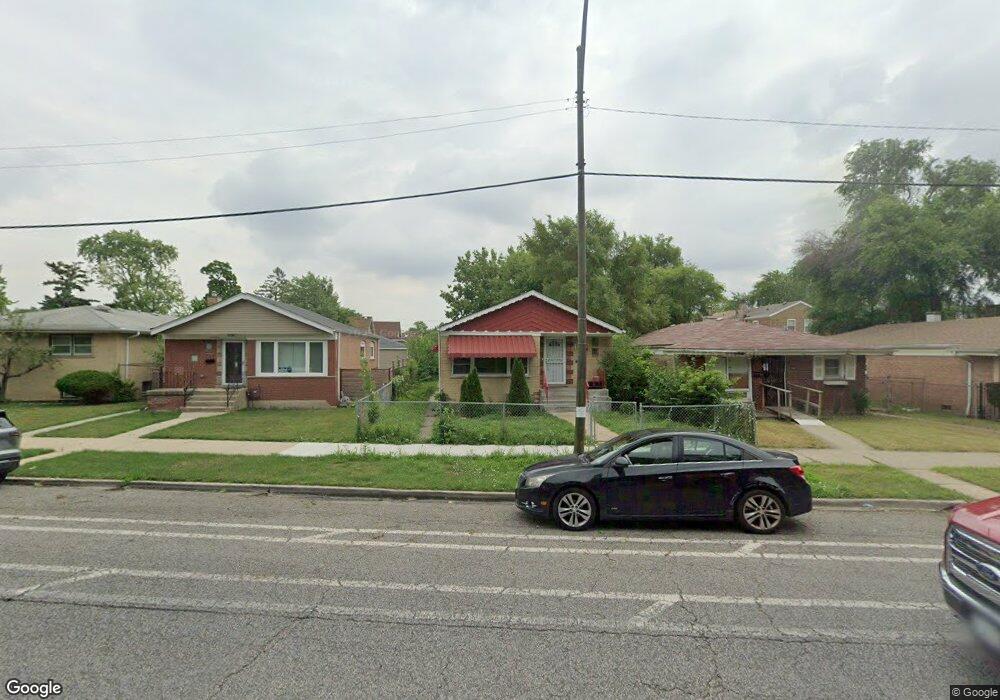
10443 S Cottage Grove Ave Chicago, IL 60628
Pullman NeighborhoodEstimated Value: $138,000 - $246,000
3
Beds
1
Bath
1,054
Sq Ft
$187/Sq Ft
Est. Value
About This Home
This home is located at 10443 S Cottage Grove Ave, Chicago, IL 60628 and is currently estimated at $196,601, approximately $186 per square foot. 10443 S Cottage Grove Ave is a home located in Cook County with nearby schools including Corliss High School, Butler College Prep, and St. John de la Salle School.
Ownership History
Date
Name
Owned For
Owner Type
Purchase Details
Closed on
May 25, 2022
Sold by
Frankie L Swoope Land Trust No 1 and Swoope Frankie L
Bought by
Swoope Frankie L
Current Estimated Value
Home Financials for this Owner
Home Financials are based on the most recent Mortgage that was taken out on this home.
Original Mortgage
$67,500
Outstanding Balance
$63,608
Interest Rate
4.4%
Mortgage Type
Balloon
Estimated Equity
$132,993
Purchase Details
Closed on
Jan 17, 2019
Sold by
Swoope Frankie L
Bought by
Swoope Frankie L and Frankie L Swoope Land Trust
Purchase Details
Closed on
Dec 20, 1999
Sold by
Swoope Tamara L and Swoope Frankie
Bought by
Swoope Frankie
Home Financials for this Owner
Home Financials are based on the most recent Mortgage that was taken out on this home.
Original Mortgage
$64,500
Interest Rate
10.3%
Create a Home Valuation Report for This Property
The Home Valuation Report is an in-depth analysis detailing your home's value as well as a comparison with similar homes in the area
Home Values in the Area
Average Home Value in this Area
Purchase History
| Date | Buyer | Sale Price | Title Company |
|---|---|---|---|
| Swoope Frankie L | -- | None Listed On Document | |
| Swoope Frankie L | -- | Attorney | |
| Swoope Frankie | -- | Chicago Title Insurance Co |
Source: Public Records
Mortgage History
| Date | Status | Borrower | Loan Amount |
|---|---|---|---|
| Open | Swoope Frankie L | $67,500 | |
| Previous Owner | Swoope Frankie | $64,500 |
Source: Public Records
Tax History Compared to Growth
Tax History
| Year | Tax Paid | Tax Assessment Tax Assessment Total Assessment is a certain percentage of the fair market value that is determined by local assessors to be the total taxable value of land and additions on the property. | Land | Improvement |
|---|---|---|---|---|
| 2024 | $1,830 | $12,000 | $5,996 | $6,004 |
| 2023 | $1,784 | $8,651 | $6,048 | $2,603 |
| 2022 | $1,784 | $8,651 | $6,048 | $2,603 |
| 2021 | $1,744 | $8,650 | $6,047 | $2,603 |
| 2020 | $2,491 | $11,154 | $5,117 | $6,037 |
| 2019 | $2,497 | $12,394 | $5,117 | $7,277 |
| 2018 | $2,454 | $12,394 | $5,117 | $7,277 |
| 2017 | $2,530 | $11,725 | $4,652 | $7,073 |
| 2016 | $2,354 | $11,725 | $4,652 | $7,073 |
| 2015 | $2,154 | $11,725 | $4,652 | $7,073 |
| 2014 | $1,673 | $8,992 | $4,186 | $4,806 |
| 2013 | $1,639 | $8,992 | $4,186 | $4,806 |
Source: Public Records
Map
Nearby Homes
- 732 E 104th Place
- 715 E 105th Place
- 10614 S Langley Ave
- 10611 S Cottage Grove Ave
- 10547 S Corliss Ave
- 10534 S Maryland Ave
- 549 E 103rd Place
- 10301 S Cottage Grove Ave
- 818 E 106th St
- 10642 S Langley Ave
- 10348 S Rhodes Ave
- 10436 S Eberhart Ave
- 10320 S Rhodes Ave
- 613 E 107th St
- 10350 S Eberhart Ave
- 10710 S Langley Ave
- 10324 S Eberhart Ave
- 630 E 102nd Place
- 10734 S Langley Ave
- 10755 S Champlain Ave
- 10447 S Cottage Grove Ave
- 10441 S Cottage Grove Ave
- 10451 S Cottage Grove Ave
- 707 E 104th Place
- 10455 S Cottage Grove Ave
- 715 E 104th Place
- 10457 S Cottage Grove Ave
- 654 E 105th St
- 656 E 105th St
- 719 E 104th Place
- 658 E 105th St
- 10459 S Cottage Grove Ave
- 660 E 105th St
- 662 E 105th St
- 721 E 104th Place
- 10425 S Cottage Grove Ave
- 664 E 105th St
- 725 E 104th Place
- 700 E 105th St
- 10423 S Cottage Grove Ave