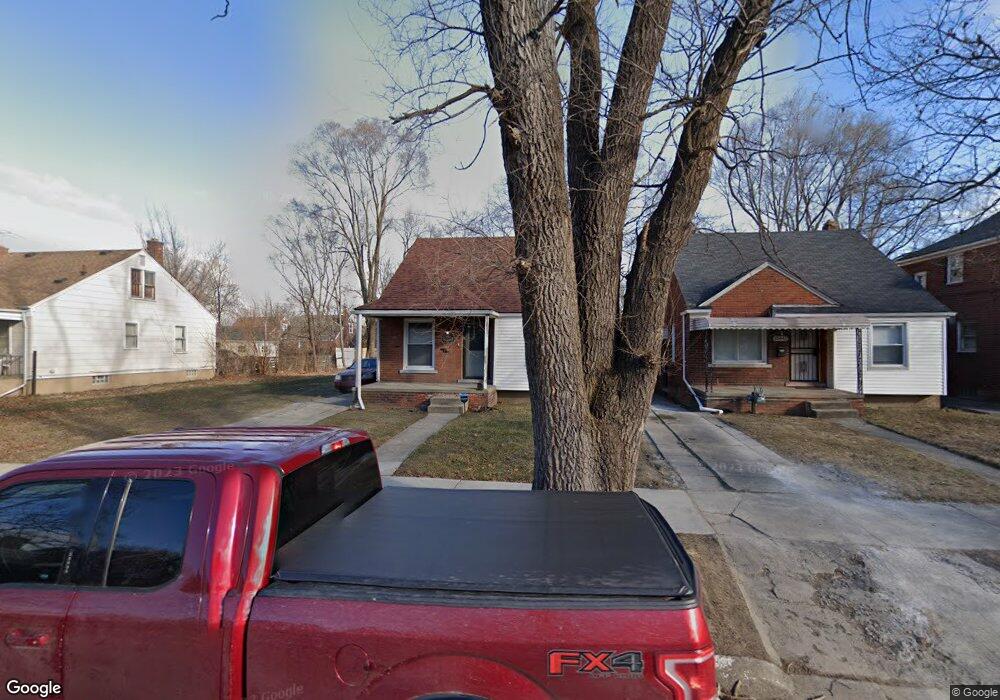
10448 Merlin St Detroit, MI 48224
Yorkshire Woods NeighborhoodEstimated Value: $65,000 - $83,000
3
Beds
1
Bath
850
Sq Ft
$90/Sq Ft
Est. Value
About This Home
This home is located at 10448 Merlin St, Detroit, MI 48224 and is currently estimated at $76,313, approximately $89 per square foot. 10448 Merlin St is a home located in Wayne County with nearby schools including Carleton Elementary School, Edward 'Duke' Ellington Conservatory of Music and Art, and Charles L. Spain Elementary-Middle School.
Ownership History
Date
Name
Owned For
Owner Type
Purchase Details
Closed on
Aug 21, 2018
Sold by
The Detroit Land Bank Authority
Bought by
Marshall Gabrielle
Current Estimated Value
Purchase Details
Closed on
Jan 12, 2017
Sold by
Sabree Eric R
Bought by
Detroit Land Bank Authority
Purchase Details
Closed on
Apr 5, 2012
Sold by
Pw Finance Llc
Bought by
Mivon Merlin Llc
Purchase Details
Closed on
May 12, 2008
Sold by
Bmt Holdings Inc
Bought by
Tafurt Brandon
Purchase Details
Closed on
May 3, 2008
Sold by
Innovative Holdings Group Llc
Bought by
Bmt Holdings Inc
Purchase Details
Closed on
Apr 16, 2008
Sold by
Citimortgage Inc
Bought by
Innovative Holdings Group
Purchase Details
Closed on
May 3, 2007
Sold by
Dailey Thomas and Dailey Doris
Bought by
Citimortgage Inc and Citifinancial Mortgage Co Inc
Create a Home Valuation Report for This Property
The Home Valuation Report is an in-depth analysis detailing your home's value as well as a comparison with similar homes in the area
Home Values in the Area
Average Home Value in this Area
Purchase History
| Date | Buyer | Sale Price | Title Company |
|---|---|---|---|
| Marshall Gabrielle | $3,300 | Title Source Inc | |
| Detroit Land Bank Authority | -- | None Available | |
| Mivon Merlin Llc | $17,000 | Multiple | |
| Pw Finance Llc | -- | Manzo Title Company | |
| Dbc Real Estate & Associates Llc | $11,000 | Manzo Title Company | |
| Tafurt Brandon | -- | First American Title Ins Co | |
| Bmt Holdings Inc | -- | First American Title Ins Co | |
| Innovative Holdings Group | $15,500 | Attorneys Title Agency Inc | |
| Citimortgage Inc | $57,900 | None Available |
Source: Public Records
Tax History Compared to Growth
Tax History
| Year | Tax Paid | Tax Assessment Tax Assessment Total Assessment is a certain percentage of the fair market value that is determined by local assessors to be the total taxable value of land and additions on the property. | Land | Improvement |
|---|---|---|---|---|
| 2025 | $904 | $28,600 | $0 | $0 |
| 2024 | $904 | $24,400 | $0 | $0 |
| 2023 | $1,059 | $19,800 | $0 | $0 |
| 2022 | $1,126 | $17,600 | $0 | $0 |
| 2021 | $1,097 | $12,300 | $0 | $0 |
| 2020 | $1,097 | $11,000 | $0 | $0 |
| 2019 | $1,081 | $9,500 | $0 | $0 |
| 2018 | $0 | $8,600 | $0 | $0 |
| 2017 | $128 | $8,700 | $0 | $0 |
| 2016 | $836 | $7,900 | $0 | $0 |
| 2015 | $790 | $7,900 | $0 | $0 |
| 2013 | $2,104 | $21,035 | $0 | $0 |
| 2010 | -- | $30,840 | $993 | $29,847 |
Source: Public Records
Map
Nearby Homes
- 10830 Mckinney St
- 10738 Mckinney St
- 10716 Mckinney St
- 10311 Britain St
- 10642 Mckinney St
- 10088 Britain St
- 10878 Balfour Rd
- 10728 Worden St
- 10825 Worden St
- 10827 Balfour Rd
- 11058 Mckinney St
- 10400 Duprey St
- 10593 Marne St
- 10436 Duprey St
- 10799 Worden St
- 11090 Mckinney St
- 9212 Woodhall St
- 10800 Somerset Ave
- 9160 Boleyn St
- 10901 Worden St
- 10442 Merlin St
- 10434 Merlin St
- 10454 Merlin St
- 10460 Merlin St
- 10428 Merlin St
- 10470 Merlin St
- 10649 Meuse St
- 10655 Meuse St
- 10641 Meuse St
- 10476 Merlin St
- 10420 Merlin St
- 10663 Meuse St
- 10669 Meuse St
- 10449 Merlin St
- 10441 Merlin St
- 10457 Merlin St
- 10412 Merlin St
- 10677 Meuse St
- 10427 Merlin St
- 10471 Merlin St