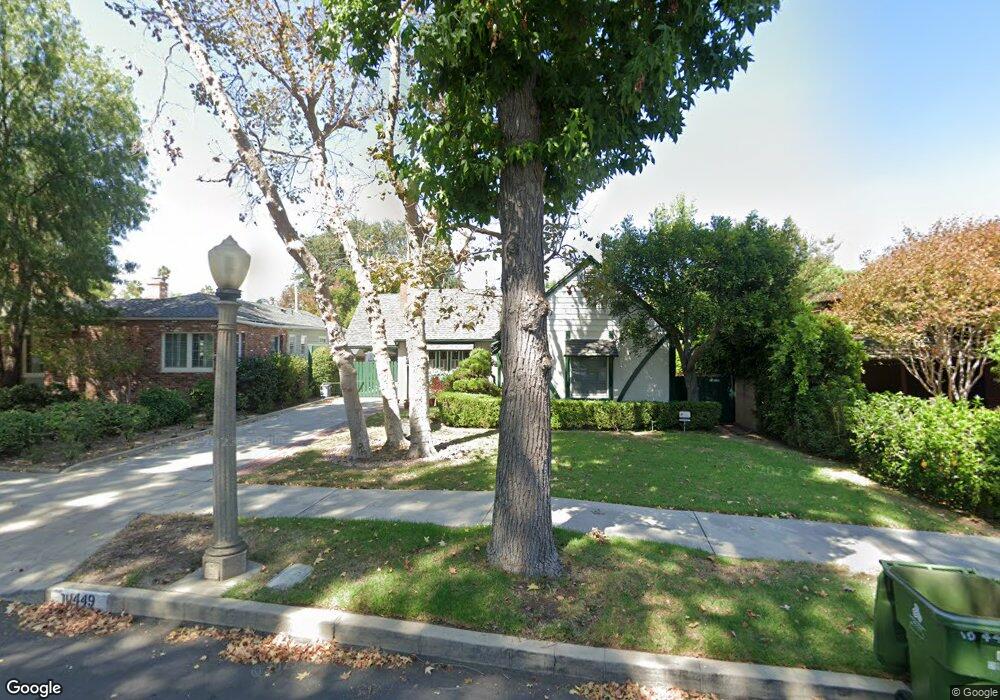
10449 Woodbridge St Toluca Lake, CA 91602
Estimated Value: $1,374,459 - $1,716,000
2
Beds
1
Bath
1,122
Sq Ft
$1,380/Sq Ft
Est. Value
About This Home
This home is located at 10449 Woodbridge St, Toluca Lake, CA 91602 and is currently estimated at $1,548,865, approximately $1,380 per square foot. 10449 Woodbridge St is a home located in Los Angeles County with nearby schools including Rio Vista Elementary, Walter Reed Middle, and East Valley Senior High School.
Ownership History
Date
Name
Owned For
Owner Type
Purchase Details
Closed on
Sep 30, 2005
Sold by
Kunz David and Kunz Suzanne
Bought by
Kunz David R and Kunz Suzanne E
Current Estimated Value
Purchase Details
Closed on
Jul 22, 2003
Sold by
Finnegan John P and Finnegan Carolynn V
Bought by
Kunz David and Stavast Suzanne
Home Financials for this Owner
Home Financials are based on the most recent Mortgage that was taken out on this home.
Original Mortgage
$500,000
Outstanding Balance
$215,776
Interest Rate
5.46%
Mortgage Type
Purchase Money Mortgage
Estimated Equity
$1,333,089
Purchase Details
Closed on
Jul 9, 1999
Sold by
Finnegan John P and Finnegan Carolynn V
Bought by
Finnegan John P and Finnegan Carolynn V
Purchase Details
Closed on
Feb 3, 1998
Sold by
Finnegan John P
Bought by
Finnegan V Carolynn
Purchase Details
Closed on
Aug 16, 1995
Sold by
Alphin Harry J and Alphin Suzanne R
Bought by
Finnegan John P and Carolynn Finnegan V
Create a Home Valuation Report for This Property
The Home Valuation Report is an in-depth analysis detailing your home's value as well as a comparison with similar homes in the area
Home Values in the Area
Average Home Value in this Area
Purchase History
| Date | Buyer | Sale Price | Title Company |
|---|---|---|---|
| Kunz David R | -- | -- | |
| Kunz David | $650,000 | California Title Company | |
| Finnegan John P | -- | -- | |
| Finnegan V Carolynn | -- | Chicago Title Co | |
| Finnegan John P | $263,000 | Equity Title Company |
Source: Public Records
Mortgage History
| Date | Status | Borrower | Loan Amount |
|---|---|---|---|
| Open | Kunz David | $500,000 | |
| Closed | Kunz David | $50,000 |
Source: Public Records
Tax History Compared to Growth
Tax History
| Year | Tax Paid | Tax Assessment Tax Assessment Total Assessment is a certain percentage of the fair market value that is determined by local assessors to be the total taxable value of land and additions on the property. | Land | Improvement |
|---|---|---|---|---|
| 2025 | $11,087 | $924,151 | $710,890 | $213,261 |
| 2024 | $11,087 | $906,031 | $696,951 | $209,080 |
| 2023 | $10,871 | $888,267 | $683,286 | $204,981 |
| 2022 | $10,364 | $870,851 | $669,889 | $200,962 |
| 2021 | $10,238 | $853,776 | $656,754 | $197,022 |
| 2019 | $9,930 | $828,454 | $637,275 | $191,179 |
| 2018 | $9,862 | $812,211 | $624,780 | $187,431 |
| 2016 | $7,981 | $659,000 | $507,300 | $151,700 |
| 2015 | $7,982 | $659,000 | $507,300 | $151,700 |
| 2014 | $7,387 | $595,000 | $458,000 | $137,000 |
Source: Public Records
Map
Nearby Homes
- 10441 Bloomfield St
- 10530 Moorpark St
- 10445 Valley Spring Ln
- 4402 Ledge Ave
- 4310 Cahuenga Blvd Unit 304
- 4426 Auckland Ave
- 4406 Cahuenga Blvd
- 10458 Riverside Dr
- 10352 Riverside Dr Unit 102
- 10352 Riverside Dr Unit 201
- 10602 Landale St
- 10409 Riverside Dr Unit 203
- 4427 Arcola Ave
- 4433 Arcola Ave
- 4400 Cartwright Ave Unit 102
- 10710 Toluca Ct
- 4547 Ledge Ave
- 4345 Talofa Ave
- 4331 Talofa Ave
- 4262 Riverton Ave
- 10453 Woodbridge St
- 10443 Woodbridge St
- 10444 Bloomfield St
- 4340 Strohm Ave
- 10440 Bloomfield St
- 10452 Bloomfield St
- 10434 Bloomfield St
- 4352 Strohm Ave
- 10433 Woodbridge St
- 10428 Bloomfield St
- 10446 Woodbridge St
- 10452 Woodbridge St
- 10440 Woodbridge St
- 10427 Woodbridge St
- 10424 Bloomfield St
- 10503 Woodbridge St
- 10434 Woodbridge St
- 10502 Bloomfield St
- 10428 Woodbridge St
- 10418 Bloomfield St