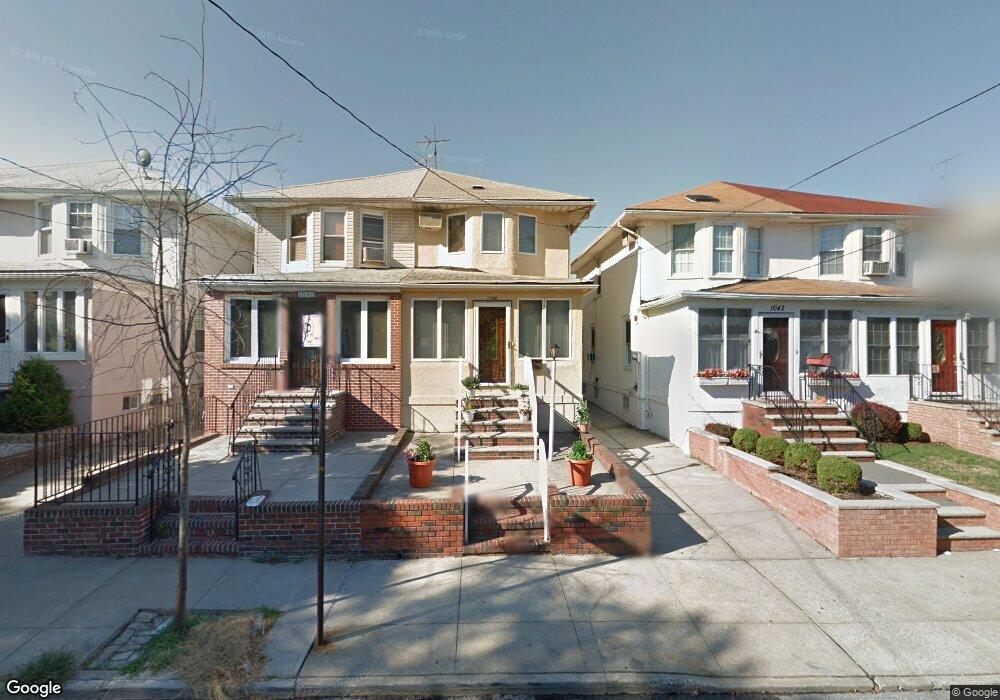
1046 80th St Brooklyn, NY 11228
Dyker Heights NeighborhoodEstimated Value: $1,073,810 - $1,267,000
Studio
--
Bath
1,328
Sq Ft
$879/Sq Ft
Est. Value
About This Home
This home is located at 1046 80th St, Brooklyn, NY 11228 and is currently estimated at $1,167,453, approximately $879 per square foot. 1046 80th St is a home located in Kings County with nearby schools including P.S. 127 McKinley Park, IS 201 Madeleine Brennan Intermediate School, and Fort Hamilton High School.
Ownership History
Date
Name
Owned For
Owner Type
Purchase Details
Closed on
Mar 8, 2011
Sold by
Ferraro Jeffrey
Bought by
Chu Ping Keung and Mei Xiu Feng
Current Estimated Value
Home Financials for this Owner
Home Financials are based on the most recent Mortgage that was taken out on this home.
Original Mortgage
$380,000
Outstanding Balance
$264,515
Interest Rate
5.07%
Mortgage Type
Purchase Money Mortgage
Estimated Equity
$902,938
Purchase Details
Closed on
Jan 8, 2008
Sold by
Ferraro Anthony
Bought by
Ferraro Frances
Create a Home Valuation Report for This Property
The Home Valuation Report is an in-depth analysis detailing your home's value as well as a comparison with similar homes in the area
Home Values in the Area
Average Home Value in this Area
Purchase History
| Date | Buyer | Sale Price | Title Company |
|---|---|---|---|
| Chu Ping Keung | $575,000 | -- | |
| Ferraro Frances | -- | -- |
Source: Public Records
Mortgage History
| Date | Status | Borrower | Loan Amount |
|---|---|---|---|
| Open | Chu Ping Keung | $380,000 |
Source: Public Records
Tax History
| Year | Tax Paid | Tax Assessment Tax Assessment Total Assessment is a certain percentage of the fair market value that is determined by local assessors to be the total taxable value of land and additions on the property. | Land | Improvement |
|---|---|---|---|---|
| 2025 | $7,663 | $59,460 | $17,520 | $41,940 |
| 2024 | $7,663 | $62,640 | $17,520 | $45,120 |
| 2023 | $7,312 | $65,820 | $17,520 | $48,300 |
| 2022 | $6,837 | $56,400 | $17,520 | $38,880 |
| 2021 | $6,852 | $59,040 | $17,520 | $41,520 |
| 2020 | $3,403 | $56,640 | $17,520 | $39,120 |
| 2019 | $6,602 | $49,140 | $17,520 | $31,620 |
| 2018 | $6,056 | $31,170 | $10,474 | $20,696 |
| 2017 | $5,762 | $29,738 | $10,109 | $19,629 |
| 2016 | $5,349 | $28,305 | $10,318 | $17,987 |
| 2015 | $3,164 | $28,290 | $14,211 | $14,079 |
| 2014 | $3,164 | $27,469 | $12,660 | $14,809 |
Source: Public Records
Map
Nearby Homes
Your Personal Tour Guide
Ask me questions while you tour the home.