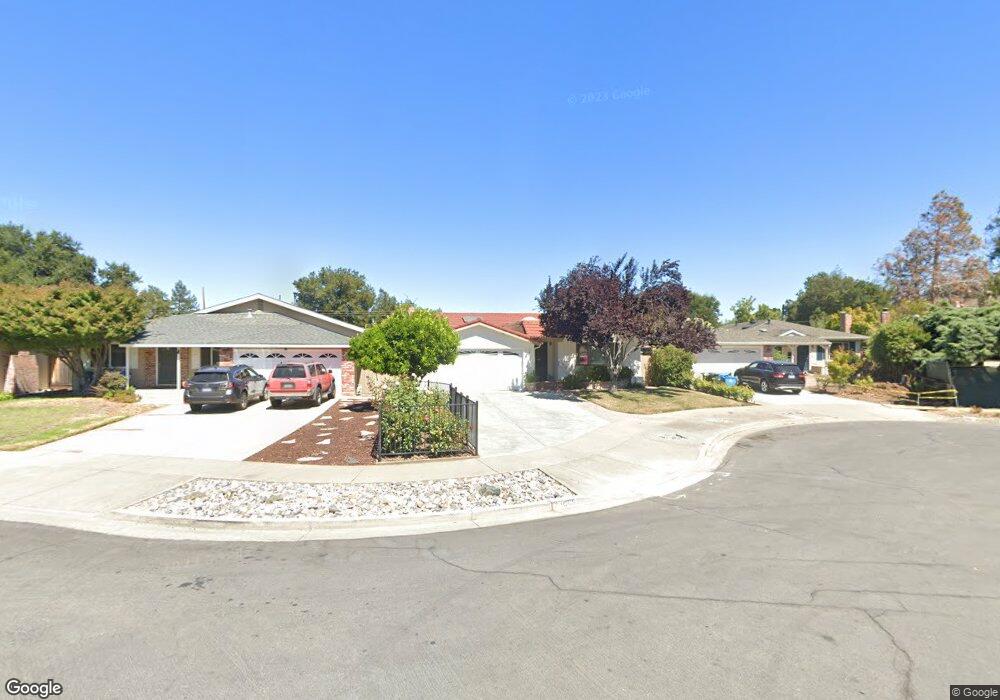
1046 Cranberry Dr Cupertino, CA 95014
McClellan NeighborhoodEstimated Value: $2,492,000 - $3,233,000
3
Beds
2
Baths
1,126
Sq Ft
$2,539/Sq Ft
Est. Value
About This Home
This home is located at 1046 Cranberry Dr, Cupertino, CA 95014 and is currently estimated at $2,858,500, approximately $2,538 per square foot. 1046 Cranberry Dr is a home located in Santa Clara County with nearby schools including Abraham Lincoln Elementary School, John F. Kennedy Middle School, and Monta Vista High School.
Ownership History
Date
Name
Owned For
Owner Type
Purchase Details
Closed on
Oct 10, 2019
Sold by
Capshaw Patricia Mae and Patricia Mae Capshaw Trust
Bought by
Capshaw Patricia Mae and Patricia Mae Capshaw Trust
Current Estimated Value
Purchase Details
Closed on
Jun 5, 2009
Sold by
Capshaw Patricia Mae
Bought by
Capshaw Patricia Mae and Patricia Mae Capshaw Trust
Home Financials for this Owner
Home Financials are based on the most recent Mortgage that was taken out on this home.
Original Mortgage
$367,725
Interest Rate
4.76%
Mortgage Type
New Conventional
Purchase Details
Closed on
May 23, 2006
Sold by
Clayton Thomas E and Capshaw Patricia M
Bought by
Capshaw Patricia Mae
Purchase Details
Closed on
Jan 21, 1994
Sold by
Clayton Thomas E and Capshaw Patricia M
Bought by
Clayton Thomas E and Capshaw Patricia M
Home Financials for this Owner
Home Financials are based on the most recent Mortgage that was taken out on this home.
Original Mortgage
$242,000
Interest Rate
3.62%
Create a Home Valuation Report for This Property
The Home Valuation Report is an in-depth analysis detailing your home's value as well as a comparison with similar homes in the area
Home Values in the Area
Average Home Value in this Area
Purchase History
| Date | Buyer | Sale Price | Title Company |
|---|---|---|---|
| Capshaw Patricia Mae | -- | None Available | |
| Capshaw Patricia Mae | -- | Servicelink | |
| Capshaw Patricia Mae | -- | None Available | |
| Clayton Thomas E | -- | Old Republic Title Company |
Source: Public Records
Mortgage History
| Date | Status | Borrower | Loan Amount |
|---|---|---|---|
| Previous Owner | Capshaw Patricia Mae | $367,725 | |
| Previous Owner | Clayton Thomas E | $242,000 |
Source: Public Records
Tax History Compared to Growth
Tax History
| Year | Tax Paid | Tax Assessment Tax Assessment Total Assessment is a certain percentage of the fair market value that is determined by local assessors to be the total taxable value of land and additions on the property. | Land | Improvement |
|---|---|---|---|---|
| 2025 | $2,368 | $123,194 | $29,309 | $93,885 |
| 2024 | $2,368 | $120,780 | $28,735 | $92,045 |
| 2023 | $2,318 | $118,413 | $28,172 | $90,241 |
| 2022 | $2,256 | $116,092 | $27,620 | $88,472 |
| 2021 | $2,206 | $113,817 | $27,079 | $86,738 |
| 2020 | $2,161 | $112,651 | $26,802 | $85,849 |
| 2019 | $2,074 | $110,443 | $26,277 | $84,166 |
| 2018 | $1,934 | $108,278 | $25,762 | $82,516 |
| 2017 | $1,888 | $106,156 | $25,257 | $80,899 |
| 2016 | $1,799 | $104,075 | $24,762 | $79,313 |
| 2015 | $1,758 | $102,513 | $24,391 | $78,122 |
| 2014 | $1,696 | $100,506 | $23,914 | $76,592 |
Source: Public Records
Map
Nearby Homes
- 21570 Edward Way
- 902 Sage Ct
- 820 Hooshang Ct
- 21091 Red Fir Ct
- 1122 Scotland Dr
- 21710 Regnart Rd
- 20882 Cherryland Dr
- 7438 Stanford Place
- 7433 Rollingdell Dr
- 1258 S Stelling Rd
- 1270 S Stelling Rd
- 00 Cleo Ave
- 21685 Olive Ave
- 21670 Lomita
- 21851 Almaden Ave
- 11510 Bianchini Ln
- 10090 Pasadena Ave Unit B4
- 7344 Rainbow Dr
- 22346 Mcclellan Rd
- 10021 Carmona Ct
- 1042 Cranberry Dr
- 1050 Cranberry Dr
- 1038 Cranberry Dr
- 7922 Woodlark Way
- 7928 Woodlark Way
- 1034 Cranberry Dr
- 7934 Woodlark Way
- 7941 Woodlark Way
- 1039 November Dr
- 1041 November Dr
- 1035 November Dr
- 7940 Woodlark Way
- 1030 Cranberry Dr
- 1043 November Dr
- 1033 November Dr
- 7949 Woodlark Way
- 1033 Cranberry Dr
- 7948 Woodlark Way
- 1031 November Dr
- 1047 November Dr