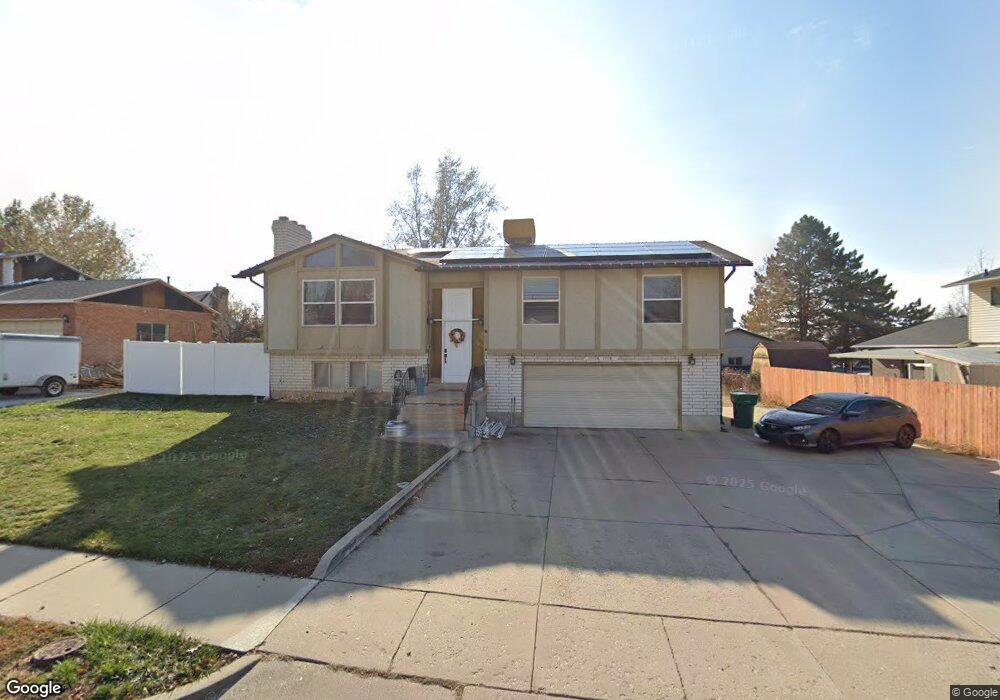
1046 E 780 N Layton, UT 84040
Estimated Value: $478,229 - $550,000
5
Beds
3
Baths
1,550
Sq Ft
$341/Sq Ft
Est. Value
About This Home
This home is located at 1046 E 780 N, Layton, UT 84040 and is currently estimated at $528,307, approximately $340 per square foot. 1046 E 780 N is a home located in Davis County with nearby schools including King Elementary School, Central Davis Junior High School, and Layton High School.
Ownership History
Date
Name
Owned For
Owner Type
Purchase Details
Closed on
Nov 4, 2020
Sold by
Garcia Cherie
Bought by
Garcia Cherie and Garcia Alyssa Cherie
Current Estimated Value
Purchase Details
Closed on
Jan 12, 2018
Sold by
Gerrard John A
Bought by
Garcia Cherie
Home Financials for this Owner
Home Financials are based on the most recent Mortgage that was taken out on this home.
Original Mortgage
$205,000
Outstanding Balance
$172,413
Interest Rate
3.9%
Mortgage Type
New Conventional
Estimated Equity
$355,894
Purchase Details
Closed on
Sep 19, 2005
Sold by
Tsantes Frank T
Bought by
Gerrard John A
Home Financials for this Owner
Home Financials are based on the most recent Mortgage that was taken out on this home.
Original Mortgage
$112,000
Interest Rate
5.76%
Mortgage Type
Fannie Mae Freddie Mac
Create a Home Valuation Report for This Property
The Home Valuation Report is an in-depth analysis detailing your home's value as well as a comparison with similar homes in the area
Home Values in the Area
Average Home Value in this Area
Purchase History
| Date | Buyer | Sale Price | Title Company |
|---|---|---|---|
| Garcia Cherie | -- | None Available | |
| Garcia Cherie | -- | Backman Title | |
| Gerrard John A | -- | Backman Title Services |
Source: Public Records
Mortgage History
| Date | Status | Borrower | Loan Amount |
|---|---|---|---|
| Open | Garcia Cherie | $205,000 | |
| Previous Owner | Gerrard John A | $112,000 |
Source: Public Records
Tax History
| Year | Tax Paid | Tax Assessment Tax Assessment Total Assessment is a certain percentage of the fair market value that is determined by local assessors to be the total taxable value of land and additions on the property. | Land | Improvement |
|---|---|---|---|---|
| 2025 | $2,457 | $257,950 | $118,147 | $139,803 |
| 2024 | $2,361 | $249,700 | $143,037 | $106,663 |
| 2023 | $2,323 | $433,000 | $195,288 | $237,712 |
| 2022 | $2,429 | $245,850 | $104,537 | $141,313 |
| 2021 | $2,246 | $339,000 | $158,754 | $180,246 |
| 2020 | $1,961 | $284,000 | $127,193 | $156,807 |
| 2019 | $1,946 | $276,000 | $113,913 | $162,087 |
| 2018 | $1,749 | $249,000 | $87,635 | $161,365 |
| 2016 | $1,620 | $119,020 | $46,342 | $72,678 |
| 2015 | $1,571 | $109,560 | $46,342 | $63,218 |
| 2014 | $1,490 | $106,221 | $46,342 | $59,879 |
| 2013 | -- | $102,256 | $22,748 | $79,508 |
Source: Public Records
Map
Nearby Homes
- 1033 E 825 N
- 997 E 825 N
- 508 N Adamswood Rd
- 861 E 575 N
- 556 N Fairfield Rd Unit A2
- 556 N Fairfield Rd Unit D1
- 556 N Fairfield Rd Unit D2
- 556 N Fairfield Rd Unit A3
- 556 N Fairfield Rd Unit D3
- 556 N Fairfield Rd Unit D4
- 556 N Fairfield Rd Unit A1
- 556 N Fairfield Rd Unit A4
- 479 N 1375 E
- 1503 E 530 N
- 1545 E 975 N
- 187 N Talbot Dr
- 1156 Cherrywood Dr
- 1048 E Cherry Ln
- 1515 E Gentile St
- 1258 E North Lisa St
Your Personal Tour Guide
Ask me questions while you tour the home.