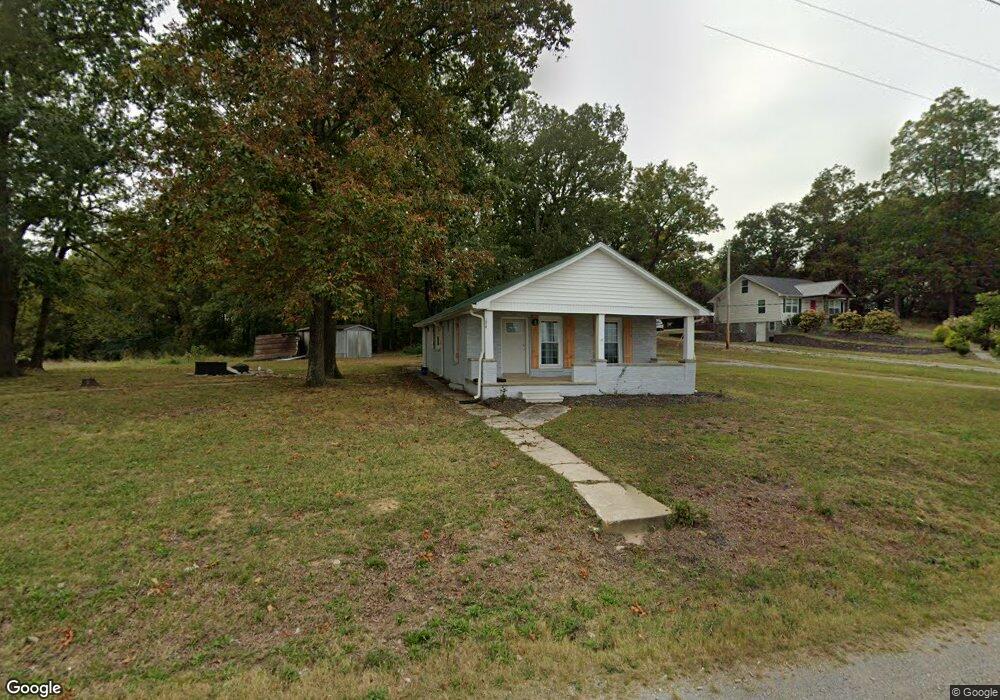
1046 Highway 47 E Dickson, TN 37055
Estimated Value: $260,822 - $290,000
Studio
1
Bath
1,060
Sq Ft
$256/Sq Ft
Est. Value
About This Home
This home is located at 1046 Highway 47 E, Dickson, TN 37055 and is currently estimated at $270,956, approximately $255 per square foot. 1046 Highway 47 E is a home located in Dickson County with nearby schools including Oakmont Elementary School, Dickson Middle School, and Dickson County High School.
Ownership History
Date
Name
Owned For
Owner Type
Purchase Details
Closed on
Jul 2, 2024
Sold by
Sweeney Scott Jacie
Bought by
Gerleve Joshua
Current Estimated Value
Home Financials for this Owner
Home Financials are based on the most recent Mortgage that was taken out on this home.
Original Mortgage
$281,203
Outstanding Balance
$277,559
Interest Rate
6.94%
Mortgage Type
New Conventional
Estimated Equity
-$6,603
Purchase Details
Closed on
May 24, 2022
Sold by
Chw Solutions Llc
Bought by
Sweeney Jade L
Home Financials for this Owner
Home Financials are based on the most recent Mortgage that was taken out on this home.
Original Mortgage
$278,011
Interest Rate
5.27%
Mortgage Type
New Conventional
Purchase Details
Closed on
Sep 20, 2017
Sold by
Peters Joan D
Bought by
Terry Overton
Purchase Details
Closed on
Apr 25, 2008
Sold by
White Jacob
Bought by
Mcillwain Robin G
Purchase Details
Closed on
Jan 30, 1992
Bought by
White Joseph B and White Ava D
Purchase Details
Closed on
Jun 24, 1985
Bought by
White Gary E
Create a Home Valuation Report for This Property
The Home Valuation Report is an in-depth analysis detailing your home's value as well as a comparison with similar homes in the area
Home Values in the Area
Average Home Value in this Area
Purchase History
| Date | Buyer | Sale Price | Title Company |
|---|---|---|---|
| Gerleve Joshua | $289,900 | Chapman & Rosenthal Title | |
| Sweeney Jade L | $275,231 | None Listed On Document | |
| Terry Overton | -- | -- | |
| Mcillwain Robin G | -- | -- | |
| White Joseph B | $25,000 | -- | |
| White Gary E | -- | -- |
Source: Public Records
Mortgage History
| Date | Status | Borrower | Loan Amount |
|---|---|---|---|
| Open | Gerleve Joshua | $281,203 | |
| Previous Owner | Sweeney Jade L | $278,011 |
Source: Public Records
Tax History
| Year | Tax Paid | Tax Assessment Tax Assessment Total Assessment is a certain percentage of the fair market value that is determined by local assessors to be the total taxable value of land and additions on the property. | Land | Improvement |
|---|---|---|---|---|
| 2025 | -- | $57,000 | $17,475 | $39,525 |
| 2024 | -- | $57,000 | $17,475 | $39,525 |
| 2023 | $972 | $31,100 | $9,475 | $21,625 |
| 2022 | $972 | $31,100 | $9,475 | $21,625 |
| 2021 | $972 | $31,100 | $9,475 | $21,625 |
| 2020 | $972 | $31,100 | $9,475 | $21,625 |
| 2019 | $972 | $31,100 | $9,475 | $21,625 |
| 2018 | $588 | $16,125 | $5,000 | $11,125 |
| 2017 | $588 | $16,125 | $5,000 | $11,125 |
| 2016 | $588 | $16,125 | $5,000 | $11,125 |
| 2015 | $555 | $14,300 | $5,000 | $9,300 |
| 2014 | $555 | $14,300 | $5,000 | $9,300 |
Source: Public Records
Map
Nearby Homes
- 101 Birch St
- 1179 Tennessee 47
- 211 W Hills Terrace
- 501 Caraway Ct
- 161 Caraway Ct
- 422 Shady Hill Rd
- 101 Sunset Rd
- 101 W Hills Terrace
- 3232 Tennessee 46
- 3230 Tennessee 46
- 1103 Cowan Rd
- 1087 Cowan Rd
- 69 Truform Way
- 57 Truform Way
- 105 Sherry Ln
- 1003 Autumnwood Dr
- 211 Sandalwood Way
- 213 Sandalwood Way
- 209 Sandalwood Way
- 402 Cottage Ln
- 1076 Highway 47 E
- 1076 Highway 47 E
- 1070 Highway 47 E
- 319 Lewis Hollow Rd
- 315 Lewis Hollow Rd
- 1105 E Walnut St
- 313 Lewis Holl0w Rd
- 208 Skyline Cir
- 307 Lewis Hollow Rd
- 1121 Highway 47 E
- 1123 Highway 47 E
- 238 Skyline Dr
- 1125 Highway 47 E
- 101 Skyline Dr
- 0 Lewis Hollow Rd
- 525 Tennessee 46
- 102 Skyline Cir
- 1127 Highway 47 E
- 103 Skyline Dr
- 103 Skyline Dr Unit 103B
Your Personal Tour Guide
Ask me questions while you tour the home.