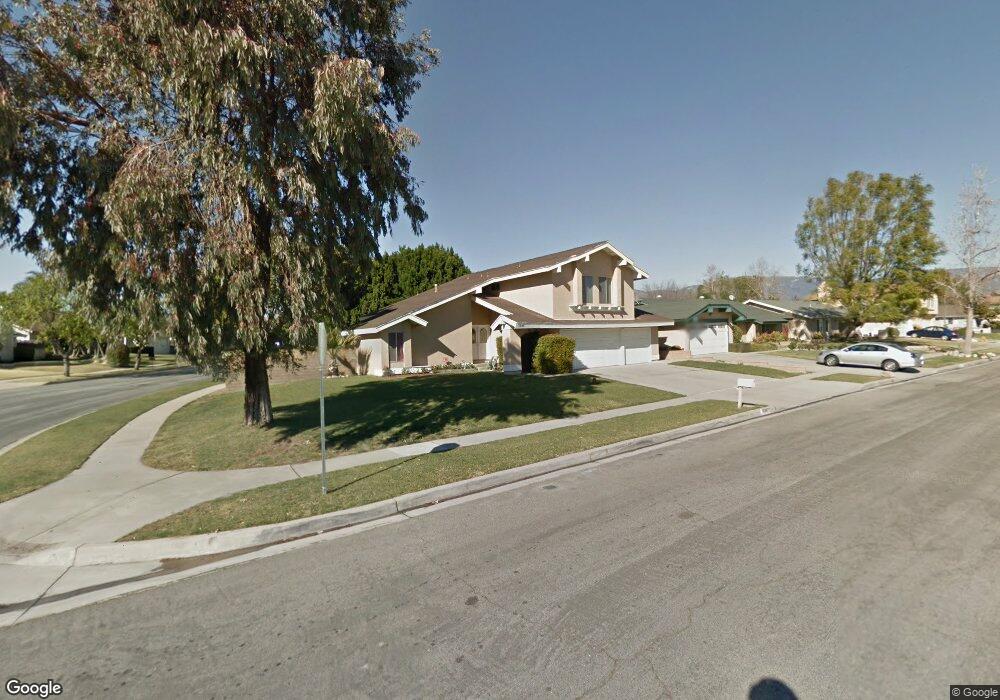
1046 W Buxton St Rialto, CA 92377
Estimated Value: $627,799 - $694,000
4
Beds
3
Baths
1,857
Sq Ft
$357/Sq Ft
Est. Value
About This Home
This home is located at 1046 W Buxton St, Rialto, CA 92377 and is currently estimated at $662,700, approximately $356 per square foot. 1046 W Buxton St is a home located in San Bernardino County with nearby schools including Trapp Elementary School, Kolb Middle School, and Wilmer Amina Carter High School.
Ownership History
Date
Name
Owned For
Owner Type
Purchase Details
Closed on
Oct 30, 2018
Sold by
Foliente Calvin and Foliente Maria Emma
Bought by
Foliente Francis and Foliente Gracie
Current Estimated Value
Home Financials for this Owner
Home Financials are based on the most recent Mortgage that was taken out on this home.
Original Mortgage
$304,000
Outstanding Balance
$266,760
Interest Rate
4.7%
Mortgage Type
New Conventional
Estimated Equity
$395,940
Purchase Details
Closed on
Sep 21, 2015
Sold by
Foliente Calvin
Bought by
Foliente Calvin and Foliente Maria Emma
Home Financials for this Owner
Home Financials are based on the most recent Mortgage that was taken out on this home.
Original Mortgage
$242,000
Interest Rate
3.62%
Mortgage Type
New Conventional
Purchase Details
Closed on
Dec 29, 2010
Sold by
Snook Investment Llc
Bought by
Foliente Calvin and Foliente Maria Emma
Home Financials for this Owner
Home Financials are based on the most recent Mortgage that was taken out on this home.
Original Mortgage
$214,423
Interest Rate
4.35%
Mortgage Type
FHA
Purchase Details
Closed on
Jul 8, 2010
Sold by
Hallman Dexter J
Bought by
Snook Investments Llc
Purchase Details
Closed on
Aug 11, 2006
Sold by
Nevels Sheila V
Bought by
Hallman Dexter
Home Financials for this Owner
Home Financials are based on the most recent Mortgage that was taken out on this home.
Original Mortgage
$84,000
Interest Rate
6.76%
Mortgage Type
Stand Alone Second
Purchase Details
Closed on
Jan 6, 2006
Sold by
Nevels Sheila V
Bought by
Nevels Sheila V
Home Financials for this Owner
Home Financials are based on the most recent Mortgage that was taken out on this home.
Original Mortgage
$287,000
Interest Rate
9.95%
Mortgage Type
New Conventional
Purchase Details
Closed on
Jun 11, 2002
Sold by
Caruthers Rita Esther
Bought by
Caruthers Theodore W
Purchase Details
Closed on
Dec 20, 1996
Sold by
Va
Bought by
Lewis Sheila V
Home Financials for this Owner
Home Financials are based on the most recent Mortgage that was taken out on this home.
Original Mortgage
$104,127
Interest Rate
7.81%
Mortgage Type
FHA
Purchase Details
Closed on
Jul 22, 1996
Sold by
Countrywide Funding Corp
Bought by
Va
Purchase Details
Closed on
Jul 11, 1996
Sold by
Beltran Robert
Bought by
Countrywide Funding Corp
Purchase Details
Closed on
Oct 5, 1993
Sold by
Beltran Robert
Bought by
Beltran Connie
Create a Home Valuation Report for This Property
The Home Valuation Report is an in-depth analysis detailing your home's value as well as a comparison with similar homes in the area
Home Values in the Area
Average Home Value in this Area
Purchase History
| Date | Buyer | Sale Price | Title Company |
|---|---|---|---|
| Foliente Francis | -- | Servicelink | |
| Foliente Calvin | -- | Servicelink | |
| Foliente Calvin | $220,000 | Advantage Title Inc | |
| Snook Investments Llc | $154,700 | Lawyers Title | |
| Hallman Dexter | $420,000 | Orange Coast Title | |
| Nevels Sheila V | -- | United Title | |
| Caruthers Theodore W | -- | Fidelity National Title Ins | |
| Lewis Sheila V | $105,000 | First American Title Ins Co | |
| Va | -- | Fidelity National Title Ins | |
| Countrywide Funding Corp | $97,623 | Fidelity National Title Ins | |
| Beltran Connie | -- | -- |
Source: Public Records
Mortgage History
| Date | Status | Borrower | Loan Amount |
|---|---|---|---|
| Open | Foliente Francis | $304,000 | |
| Closed | Foliente Calvin | $242,000 | |
| Closed | Foliente Calvin | $214,423 | |
| Previous Owner | Hallman Dexter | $84,000 | |
| Previous Owner | Hallman Dexter | $336,000 | |
| Previous Owner | Nevels Sheila V | $287,000 | |
| Previous Owner | Lewis Sheila V | $104,127 |
Source: Public Records
Tax History Compared to Growth
Tax History
| Year | Tax Paid | Tax Assessment Tax Assessment Total Assessment is a certain percentage of the fair market value that is determined by local assessors to be the total taxable value of land and additions on the property. | Land | Improvement |
|---|---|---|---|---|
| 2025 | $4,693 | $352,877 | $113,467 | $239,410 |
| 2024 | $4,693 | $345,958 | $111,242 | $234,716 |
| 2023 | $4,977 | $339,175 | $109,061 | $230,114 |
| 2022 | $4,616 | $332,525 | $106,923 | $225,602 |
| 2021 | $4,588 | $326,004 | $104,826 | $221,178 |
| 2020 | $4,606 | $322,661 | $103,751 | $218,910 |
| 2019 | $4,510 | $316,335 | $101,717 | $214,618 |
| 2018 | $6,034 | $247,717 | $86,702 | $161,015 |
| 2017 | $3,551 | $242,860 | $85,002 | $157,858 |
| 2016 | $3,177 | $238,098 | $83,335 | $154,763 |
| 2015 | $3,098 | $234,521 | $82,083 | $152,438 |
| 2014 | $4,864 | $229,927 | $80,475 | $149,452 |
Source: Public Records
Map
Nearby Homes
- 2473 N Beechwood Ave
- 2598 Ayala Dr Unit 34
- 2425 N Fillmore Ave
- 5737 Riverside Ave
- 1251 W Banyon St
- 5651 Magnolia Ave
- 970 W Norwood St
- 5874 Olive Ave
- 1388 Nicholas Ct
- 1122 W Galway St
- 1074 W Casmalia St
- 5862 Geremander Ave
- 2650 N Linden Ave
- 18464 Banyon Ave
- 19244 Casmalia St
- 0 W Persimmon Ave
- 1569 W Summit Ave
- 1520 W Norwood St
- 580 Bridgeport Dr
- 5892 N Sycamore Ave
- 1036 W Buxton St
- 2543 N Beechwood Ave
- 1037 W Buxton St
- 2534 N Beechwood Ave
- 1066 W Buxton St
- 1026 W Buxton St
- 2544 AYALA/BO N Beechwood Ave
- 1027 W Buxton St
- 2544 N Beechwood Ave
- 1025 Moffatt St
- 1057 W Buxton St
- 1033 Moffatt St
- 1016 W Buxton St
- 2503 N Beechwood Ave
- 2554 N Beechwood Ave
- 1041 Moffatt St
- 2533 N Glenwood Ave
- 2498 N Fillmore Ave
- 2523 N Glenwood Ave
- 1067 W Buxton St