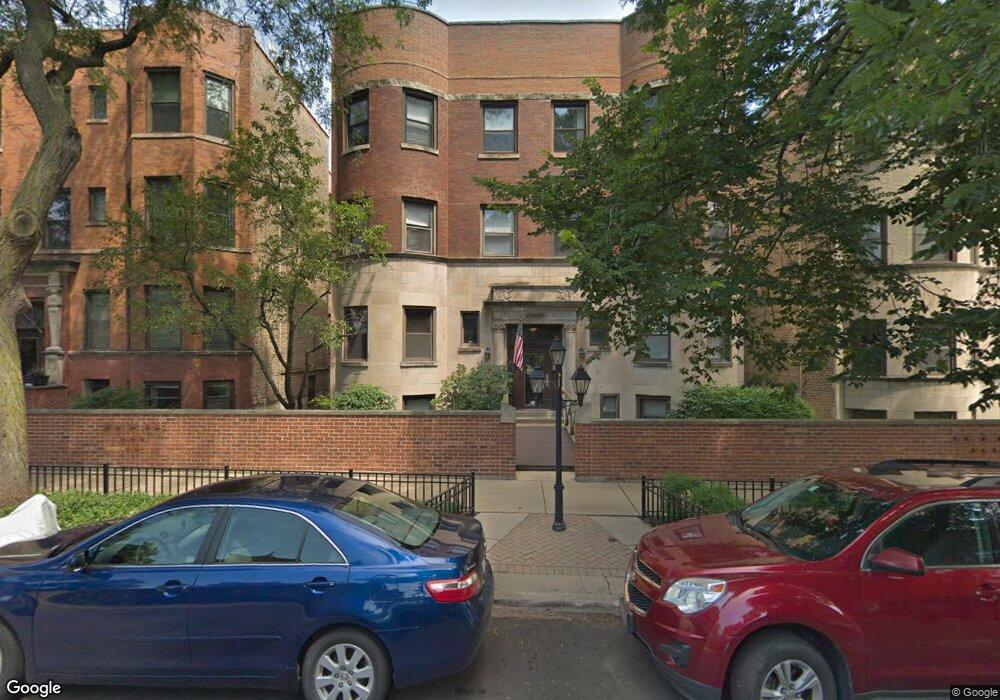
1046 W Byron St Unit 3 Chicago, IL 60613
Wrigleyville NeighborhoodEstimated Value: $415,000 - $501,000
2
Beds
2
Baths
--
Sq Ft
1.28
Acres
About This Home
This home is located at 1046 W Byron St Unit 3, Chicago, IL 60613 and is currently estimated at $446,490. 1046 W Byron St Unit 3 is a home located in Cook County with nearby schools including Greeley Elementary School, Lake View High School, and Bernard Zell Anshe Emet Day School.
Ownership History
Date
Name
Owned For
Owner Type
Purchase Details
Closed on
Apr 26, 2023
Sold by
Sheldon Mark and Sheldon Brooke
Bought by
Sheldon Brooke
Current Estimated Value
Home Financials for this Owner
Home Financials are based on the most recent Mortgage that was taken out on this home.
Original Mortgage
$173,000
Outstanding Balance
$167,957
Interest Rate
6.13%
Mortgage Type
New Conventional
Estimated Equity
$278,533
Purchase Details
Closed on
Nov 15, 2007
Sold by
Boysan Christie
Bought by
Sheldon Mark and Sheldon Brooke
Purchase Details
Closed on
Jun 23, 2005
Sold by
Hanson Frein Brandon and Hanson Harald R
Bought by
Boysan Christie
Home Financials for this Owner
Home Financials are based on the most recent Mortgage that was taken out on this home.
Original Mortgage
$264,800
Interest Rate
4.87%
Mortgage Type
Fannie Mae Freddie Mac
Purchase Details
Closed on
Aug 21, 1996
Sold by
Krienen John S and Strom Tamara I
Bought by
Hansen Brandon F and Hansen Harald R
Create a Home Valuation Report for This Property
The Home Valuation Report is an in-depth analysis detailing your home's value as well as a comparison with similar homes in the area
Home Values in the Area
Average Home Value in this Area
Purchase History
| Date | Buyer | Sale Price | Title Company |
|---|---|---|---|
| Sheldon Brooke | $173,000 | Ravenswood Title | |
| Sheldon Mark | $325,000 | Pntn | |
| Boysan Christie | $331,000 | Stewart Title Of Illinois | |
| Hansen Brandon F | $140,000 | -- |
Source: Public Records
Mortgage History
| Date | Status | Borrower | Loan Amount |
|---|---|---|---|
| Open | Sheldon Brooke | $173,000 | |
| Previous Owner | Boysan Christie | $264,800 |
Source: Public Records
Tax History Compared to Growth
Tax History
| Year | Tax Paid | Tax Assessment Tax Assessment Total Assessment is a certain percentage of the fair market value that is determined by local assessors to be the total taxable value of land and additions on the property. | Land | Improvement |
|---|---|---|---|---|
| 2024 | $6,896 | $36,554 | $19,107 | $17,447 |
| 2023 | $6,701 | $36,000 | $15,409 | $20,591 |
| 2022 | $6,701 | $36,000 | $15,409 | $20,591 |
| 2021 | $6,569 | $35,999 | $15,408 | $20,591 |
| 2020 | $5,693 | $28,658 | $6,574 | $22,084 |
| 2019 | $5,583 | $31,217 | $6,574 | $24,643 |
| 2018 | $5,488 | $31,217 | $6,574 | $24,643 |
| 2017 | $5,036 | $26,769 | $5,752 | $21,017 |
| 2016 | $4,861 | $26,769 | $5,752 | $21,017 |
| 2015 | $4,425 | $26,769 | $5,752 | $21,017 |
| 2014 | $4,165 | $25,017 | $4,699 | $20,318 |
| 2013 | $4,072 | $25,017 | $4,699 | $20,318 |
Source: Public Records
Map
Nearby Homes
- 3837 N Kenmore Ave Unit 1
- 3920 N Sheridan Rd Unit 508
- 3837 N Alta Vista Terrace
- 1050 W Dakin St Unit G2
- 3809 N Kenmore Ave
- 3811 N Alta Vista Terrace
- 3765 N Kenmore Ave
- 3807 N Wilton Ave Unit 3
- 3826 N Fremont St Unit 1N
- 3810 N Fremont St Unit 2B
- 3758 N Fremont St Unit 2
- 3758 N Fremont St Unit 1
- 3723 N Wilton Ave Unit 4
- 852 W Grace St Unit T
- 4124 N Kenmore Ave Unit 3S
- 945 W Gordon Terrace Unit 2W
- 4004 N Clarendon Ave Unit 3
- 4133 N Kenmore Ave Unit 2N
- 4133 N Kenmore Ave Unit 2S
- 4133 N Kenmore Ave Unit 2E
- 1046 W Byron St Unit 51
- 1046 W Byron St Unit 49
- 1046 W Byron St Unit 50
- 1046 W Byron St Unit 48
- 1046 W Byron St Unit 2W
- 1046 W Byron St Unit 1W
- 1046 W Byron St Unit G
- 1044 W Byron St Unit 47
- 1044 W Byron St Unit 46
- 1044 W Byron St Unit 45
- 1044 W Byron St Unit 44
- 1044 W Byron St Unit 2
- 1044 W Byron St Unit 3E
- 1048 W Byron St Unit 52
- 1048 W Byron St Unit 53
- 1048 W Byron St Unit 54
- 1048 W Byron St Unit 1E
- 1048 W Byron St Unit 3E
- 1050 W Byron St Unit 58
- 1050 W Byron St Unit 56