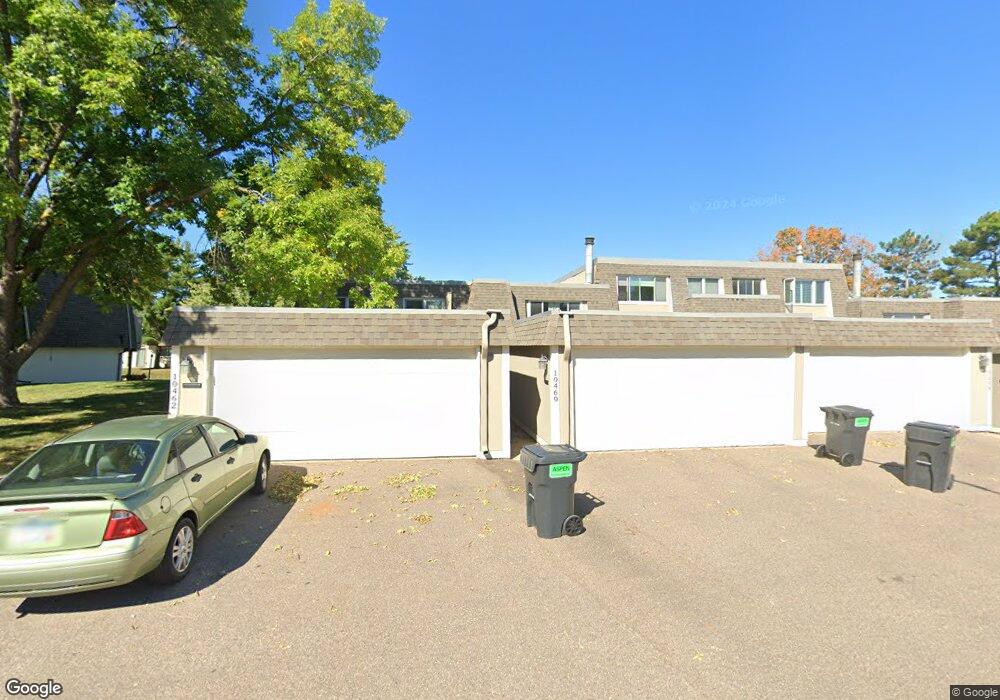
10460 Dupont Rd S Minneapolis, MN 55431
West Bloomington NeighborhoodEstimated Value: $239,000 - $272,000
3
Beds
2
Baths
880
Sq Ft
$290/Sq Ft
Est. Value
About This Home
This home is located at 10460 Dupont Rd S, Minneapolis, MN 55431 and is currently estimated at $255,443, approximately $290 per square foot. 10460 Dupont Rd S is a home located in Hennepin County with nearby schools including Oak Grove Elementary School, Oak Grove Middle School, and Kennedy Senior High School.
Ownership History
Date
Name
Owned For
Owner Type
Purchase Details
Closed on
Jun 19, 2019
Sold by
Salaba Kevin and Komaya Salaba Ai
Bought by
Rasmusen Cassandra J and Manzo Roman A
Current Estimated Value
Home Financials for this Owner
Home Financials are based on the most recent Mortgage that was taken out on this home.
Original Mortgage
$194,000
Outstanding Balance
$170,228
Interest Rate
4%
Mortgage Type
New Conventional
Estimated Equity
$85,215
Purchase Details
Closed on
Jun 18, 2015
Sold by
Brown Brooke
Bought by
Salaba Kevin
Home Financials for this Owner
Home Financials are based on the most recent Mortgage that was taken out on this home.
Original Mortgage
$6,000
Interest Rate
3.82%
Mortgage Type
Negative Amortization
Purchase Details
Closed on
Nov 26, 2007
Sold by
Bank Of Ny
Bought by
Brown Brooke
Purchase Details
Closed on
Apr 21, 2000
Sold by
Cook Trevor G and Cook Thomas F
Bought by
Wright Deborah K
Purchase Details
Closed on
Aug 14, 1998
Sold by
Clark Clara A
Bought by
Cook Thomas F and Cook Trevor G
Create a Home Valuation Report for This Property
The Home Valuation Report is an in-depth analysis detailing your home's value as well as a comparison with similar homes in the area
Home Values in the Area
Average Home Value in this Area
Purchase History
| Date | Buyer | Sale Price | Title Company |
|---|---|---|---|
| Rasmusen Cassandra J | $200,000 | First Fincl Ttl Agcy Of Mn I | |
| Salaba Kevin | $164,000 | First Fincl Title Agency Inc | |
| Brown Brooke | $135,000 | -- | |
| Wright Deborah K | $122,900 | -- | |
| Cook Thomas F | $95,000 | -- |
Source: Public Records
Mortgage History
| Date | Status | Borrower | Loan Amount |
|---|---|---|---|
| Open | Rasmusen Cassandra J | $194,000 | |
| Previous Owner | Salaba Kevin | $6,000 | |
| Previous Owner | Salaba Kevin | $159,080 |
Source: Public Records
Tax History Compared to Growth
Tax History
| Year | Tax Paid | Tax Assessment Tax Assessment Total Assessment is a certain percentage of the fair market value that is determined by local assessors to be the total taxable value of land and additions on the property. | Land | Improvement |
|---|---|---|---|---|
| 2024 | $2,854 | $240,800 | $31,800 | $209,000 |
| 2023 | $2,736 | $240,000 | $31,800 | $208,200 |
| 2022 | $2,470 | $253,700 | $31,800 | $221,900 |
| 2021 | $2,386 | $208,200 | $30,700 | $177,500 |
| 2020 | $2,504 | $203,600 | $30,300 | $173,300 |
| 2019 | $2,376 | $207,000 | $30,300 | $176,700 |
| 2018 | $2,150 | $194,600 | $29,500 | $165,100 |
| 2017 | $1,889 | $158,400 | $26,300 | $132,100 |
| 2016 | $1,416 | $121,300 | $25,500 | $95,800 |
| 2015 | $1,459 | $120,300 | $25,200 | $95,100 |
| 2014 | -- | $118,000 | $24,900 | $93,100 |
Source: Public Records
Map
Nearby Homes
- 1005 W 104th St
- 10610 Humboldt Ave S
- 9824 Fremont Ave S
- 2113 Village Terrace
- 2225 Village Terrace
- 9852 Blaisdell Ave S
- 10633 Russell Ave S
- 11000 Queen Ave S
- 9522 Pleasant Ave S
- 601 E 103rd St
- 10524 Xerxes Ave S
- 10212 Xerxes Ave S
- 3213 W Old Shakopee Rd
- 9700 Portland Ave S Unit 237
- 9700 Portland Ave S Unit 332
- 9600 Clinton Ave S
- 2300 W 95th St
- 9600 Portland Ave S Unit 107
- 9600 Portland Ave S Unit 109
- 9609 Vincent Ave S
- 10462 Dupont Rd S
- 10456 Dupont Rd S
- 10454 Dupont Rd S
- 10452 Dupont Rd S
- 10464 Dupont Rd S
- 10450 Dupont Rd S
- 10466 Dupont Rd S
- 10468 Dupont Rd S
- 10461 Dupont Rd S
- 10463 Dupont Rd S
- 10465 Dupont Rd S
- 10467 Dupont Rd S
- 10470 Dupont Rd S
- 1011 W 104th St
- 1013 W 104th St
- 10469 Dupont Rd S
- 1009 W 104th St
- 1007 W 104th St
- 10471 Dupont Rd S
- 10472 Dupont Rd S