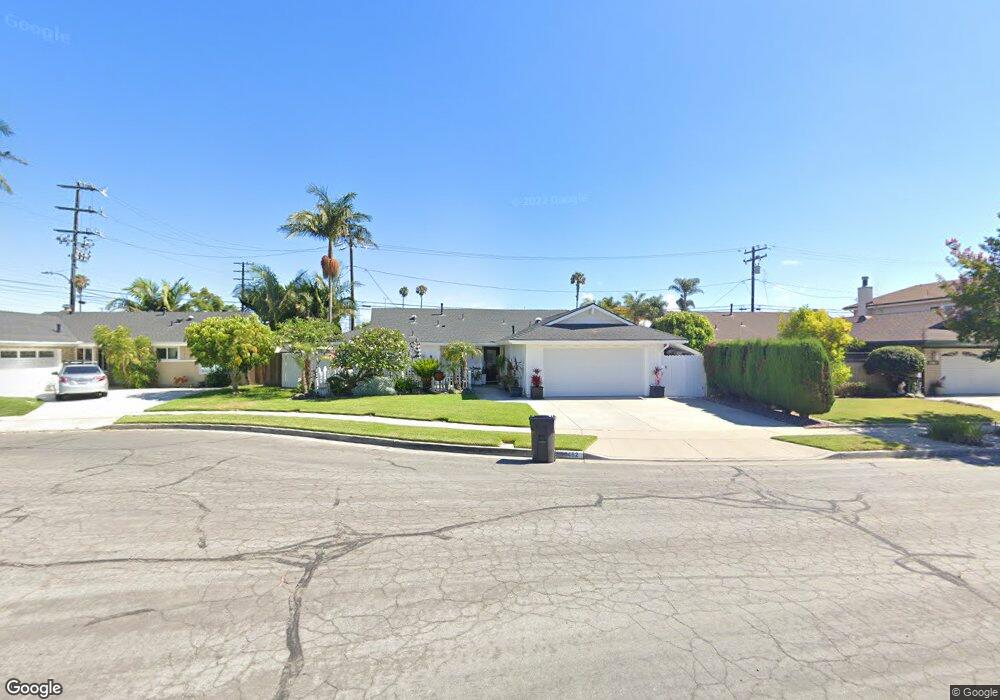
10462 Cook Cir Huntington Beach, CA 92646
Estimated Value: $1,241,673 - $1,354,000
4
Beds
2
Baths
1,464
Sq Ft
$895/Sq Ft
Est. Value
About This Home
This home is located at 10462 Cook Cir, Huntington Beach, CA 92646 and is currently estimated at $1,310,918, approximately $895 per square foot. 10462 Cook Cir is a home located in Orange County with nearby schools including Isojiro Oka Elementary, Talbert Middle School, and Edison High School.
Ownership History
Date
Name
Owned For
Owner Type
Purchase Details
Closed on
Oct 11, 2011
Sold by
Roseth Renee
Bought by
Roseth Renee and Renee Roseth Living Trust
Current Estimated Value
Purchase Details
Closed on
Dec 13, 2006
Sold by
Rosselit Bernadette
Bought by
Roseth Renee
Home Financials for this Owner
Home Financials are based on the most recent Mortgage that was taken out on this home.
Original Mortgage
$299,900
Outstanding Balance
$179,503
Interest Rate
6.33%
Mortgage Type
Purchase Money Mortgage
Estimated Equity
$1,131,415
Purchase Details
Closed on
Mar 5, 1999
Sold by
Renee Roseth and Renee Bernadette
Bought by
Roseth Renee and Rosselit Bernadette
Home Financials for this Owner
Home Financials are based on the most recent Mortgage that was taken out on this home.
Original Mortgage
$9,000
Interest Rate
6.7%
Mortgage Type
Stand Alone Second
Purchase Details
Closed on
Nov 17, 1998
Sold by
Roseth Renee
Bought by
Roseth Renee and Rosselit Bernadette
Create a Home Valuation Report for This Property
The Home Valuation Report is an in-depth analysis detailing your home's value as well as a comparison with similar homes in the area
Home Values in the Area
Average Home Value in this Area
Purchase History
| Date | Buyer | Sale Price | Title Company |
|---|---|---|---|
| Roseth Renee | -- | None Available | |
| Roseth Renee | -- | None Available | |
| Roseth Renee | -- | -- | |
| Roseth Renee | -- | -- | |
| Roseth Renee | -- | -- |
Source: Public Records
Mortgage History
| Date | Status | Borrower | Loan Amount |
|---|---|---|---|
| Open | Roseth Renee | $299,900 | |
| Previous Owner | Roseth Renee | $9,000 |
Source: Public Records
Tax History Compared to Growth
Tax History
| Year | Tax Paid | Tax Assessment Tax Assessment Total Assessment is a certain percentage of the fair market value that is determined by local assessors to be the total taxable value of land and additions on the property. | Land | Improvement |
|---|---|---|---|---|
| 2025 | $2,296 | $350,905 | $248,665 | $102,240 |
| 2024 | $2,296 | $344,025 | $243,789 | $100,236 |
| 2023 | $2,298 | $337,280 | $239,009 | $98,271 |
| 2022 | $2,347 | $330,667 | $234,322 | $96,345 |
| 2021 | $2,460 | $324,184 | $229,728 | $94,456 |
| 2020 | $3,814 | $320,860 | $227,372 | $93,488 |
| 2019 | $3,738 | $314,569 | $222,914 | $91,655 |
| 2018 | $3,667 | $308,401 | $218,543 | $89,858 |
| 2017 | $3,608 | $302,354 | $214,257 | $88,097 |
| 2016 | $3,457 | $296,426 | $210,056 | $86,370 |
| 2015 | $3,404 | $291,974 | $206,901 | $85,073 |
| 2014 | $3,335 | $286,255 | $202,848 | $83,407 |
Source: Public Records
Map
Nearby Homes
- 19350 Ward St Unit 57
- 19350 Ward St Unit 38
- 19350 Ward St Unit 14
- 10151 Kukui Dr
- 2021 Kornat Dr
- 10051 Kukui Dr
- 2008 N Capella Ct
- 19922 Carmania Ln
- 10022 Bismark Dr
- 19361 Brookhurst St Unit 87
- 19361 Brookhurst St Unit 50
- 19361 Brookhurst St Unit 184
- 19361 Brookhurst St Unit 22
- 19361 Brookhurst St Unit 159
- 19361 Brookhurst St Unit 21
- 19361 Brookhurst St Unit 33
- 19361 Brookhurst St Unit 143
- 19941 Carmania Ln
- 3000 Country Club Dr
- 1879 Tahiti Dr
- 10442 Cook Cir
- 10472 Cook Cir
- 10461 Pago Pago Cir
- 10441 Pago Pago Cir
- 10471 Pago Cir
- 10471 Pago Pago Cir
- 10432 Cook Cir
- 10431 Pago Pago Cir
- 10461 Cook Cir
- 10441 Cook Cir
- 10471 Cook Cir
- 10422 Cook Cir
- 10431 Cook Cir
- 10421 Pago Pago Cir
- 19351 Ward St Unit 71
- 10421 Cook Cir
- 10412 Cook Cir
- 10462 Pago Pago Cir
- 10462 Sunday Dr
- 10442 Pago Pago Cir