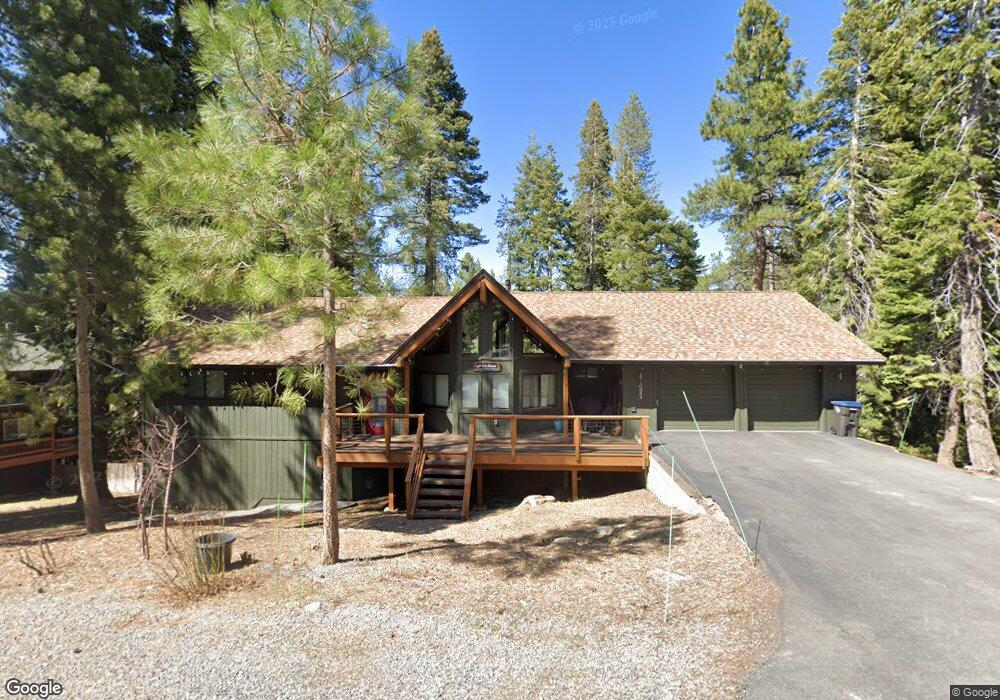
10464 Jeffrey Way Truckee, CA 96161
Prosser Lakeview NeighborhoodEstimated Value: $889,476 - $1,069,000
3
Beds
3
Baths
1,780
Sq Ft
$534/Sq Ft
Est. Value
About This Home
This home is located at 10464 Jeffrey Way, Truckee, CA 96161 and is currently estimated at $951,369, approximately $534 per square foot. 10464 Jeffrey Way is a home located in Nevada County with nearby schools including Glenshire Elementary School, Alder Creek Middle School, and Tahoe Truckee High School.
Ownership History
Date
Name
Owned For
Owner Type
Purchase Details
Closed on
Mar 18, 2022
Sold by
Richardson Hilly Charles and Richardson Dianne E
Bought by
Charles Richardson Hilly Revocable Trust
Current Estimated Value
Purchase Details
Closed on
Dec 3, 2021
Sold by
Hilly Charles Richardson and Hilly Dianne E
Bought by
Charles Richardson Hillly And Dianne E Hilly and Hilly
Purchase Details
Closed on
Sep 15, 2017
Sold by
Driver Joel Phillip
Bought by
Hilly Charles Richardson and Hilly Dianne E
Home Financials for this Owner
Home Financials are based on the most recent Mortgage that was taken out on this home.
Original Mortgage
$359,600
Interest Rate
3.12%
Mortgage Type
Future Advance Clause Open End Mortgage
Purchase Details
Closed on
Feb 24, 2004
Sold by
Va
Bought by
Driver Joel Phillip and Driver Charlene Delcie
Create a Home Valuation Report for This Property
The Home Valuation Report is an in-depth analysis detailing your home's value as well as a comparison with similar homes in the area
Home Values in the Area
Average Home Value in this Area
Purchase History
| Date | Buyer | Sale Price | Title Company |
|---|---|---|---|
| Charles Richardson Hilly Revocable Trust | -- | None Listed On Document | |
| Charles Richardson Hillly And Dianne E Hilly | -- | None Listed On Document | |
| Hilly Charles Richardson | -- | None Listed On Document | |
| Hilly Charles Richardson | $449,500 | Fidelity National Title Co | |
| Driver Joel Phillip | -- | Fidelity National Title Co | |
| Driver Joel Phillip | -- | -- |
Source: Public Records
Mortgage History
| Date | Status | Borrower | Loan Amount |
|---|---|---|---|
| Previous Owner | Hilly Charles Richardson | $359,600 |
Source: Public Records
Tax History
| Year | Tax Paid | Tax Assessment Tax Assessment Total Assessment is a certain percentage of the fair market value that is determined by local assessors to be the total taxable value of land and additions on the property. | Land | Improvement |
|---|---|---|---|---|
| 2025 | $6,417 | $540,293 | $124,590 | $415,703 |
| 2024 | $6,394 | $529,700 | $122,148 | $407,552 |
| 2023 | $6,394 | $519,314 | $119,753 | $399,561 |
| 2022 | $6,085 | $492,465 | $117,405 | $375,060 |
| 2021 | $5,737 | $482,809 | $115,103 | $367,706 |
| 2020 | $5,708 | $477,859 | $113,923 | $363,936 |
| 2019 | $5,712 | $468,490 | $111,690 | $356,800 |
| 2018 | $5,389 | $449,500 | $109,500 | $340,000 |
| 2017 | $3,012 | $228,529 | $27,413 | $201,116 |
| 2016 | $2,991 | $224,049 | $26,876 | $197,173 |
| 2015 | $2,921 | $220,685 | $26,473 | $194,212 |
| 2014 | $2,806 | $216,363 | $25,955 | $190,408 |
Source: Public Records
Map
Nearby Homes
- 12400 Rainbow Dr
- 12438 Greenwood Dr
- 10534 Actinolite Way
- 11651 Bottcher Loop
- 11670 Bottcher Loop
- 11561 Bottcher Loop
- 11761 Bottcher Loop
- 11420 Ghirard Rd
- 11841 Bottcher Loop
- 11719 China Camp Rd
- 11585 China Camp Rd
- 11102 Meek Ct
- 11392 Lockwood Dr
- 11771 Ghirard Rd
- 11791 Ghirard Rd
- 10789 Labelle Ct
- 10801 Labelle Ct
- 10576 Brickell Ct
- 11210 Henness Rd
- 12261 Prosser Dam Rd
- 10448 Jeffrey Way
- 10463 Jeffrey Way
- 10496 Jeffrey Way
- 10475 Jeffrey Way
- 10432 Jeffrey Way
- 10455 Lenelle Ln
- 10433 Lenelle Ln
- 10487 Jeffrey Way
- 12735 Rainbow Dr
- 10439 Jeffrey Way
- 10469 Lenelle Ln
- 10427 Jeffrey Way
- 10512 Jeffrey Way
- 10423 Lenelle Ln
- 10499 Jeffrey Way
- 12725 Rainbow Dr
- 10485 Lenelle Ln
- 12755 Rainbow Dr
- 10400 Jeffrey Way
- 10411 Jeffrey Way
Your Personal Tour Guide
Ask me questions while you tour the home.