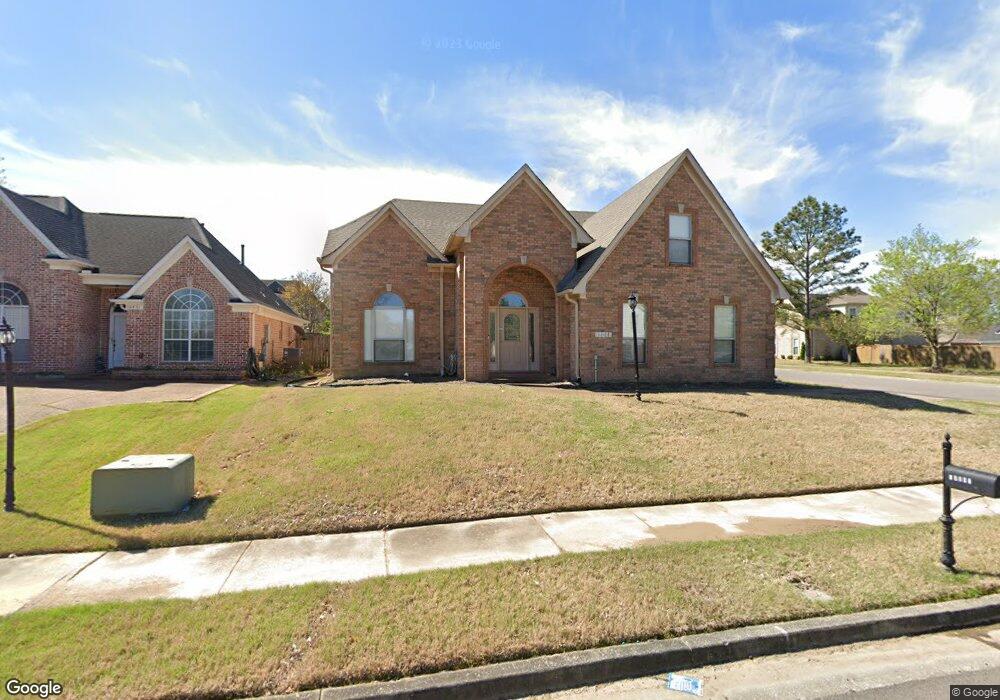
10465 Aniston Way Collierville, TN 38017
Estimated Value: $389,000 - $451,000
4
Beds
3
Baths
3,065
Sq Ft
$134/Sq Ft
Est. Value
About This Home
This home is located at 10465 Aniston Way, Collierville, TN 38017 and is currently estimated at $410,049, approximately $133 per square foot. 10465 Aniston Way is a home located in Shelby County with nearby schools including Schilling Farms Elementary School, West Collierville Middle School, and Collierville High School.
Ownership History
Date
Name
Owned For
Owner Type
Purchase Details
Closed on
Aug 24, 2021
Sold by
Bhavsar Miten
Bought by
Bhayani Mansoor R and Bhayani Salima
Current Estimated Value
Home Financials for this Owner
Home Financials are based on the most recent Mortgage that was taken out on this home.
Original Mortgage
$272,000
Outstanding Balance
$246,583
Interest Rate
2.7%
Mortgage Type
New Conventional
Estimated Equity
$163,466
Purchase Details
Closed on
Sep 13, 2006
Sold by
Livingston John M and Livingston Mary M
Bought by
Bhavsar Miten
Home Financials for this Owner
Home Financials are based on the most recent Mortgage that was taken out on this home.
Original Mortgage
$187,200
Interest Rate
6.58%
Mortgage Type
Unknown
Purchase Details
Closed on
Sep 24, 2002
Sold by
Grant Homes Llc
Bought by
Livingston John M
Home Financials for this Owner
Home Financials are based on the most recent Mortgage that was taken out on this home.
Original Mortgage
$150,360
Interest Rate
5.22%
Create a Home Valuation Report for This Property
The Home Valuation Report is an in-depth analysis detailing your home's value as well as a comparison with similar homes in the area
Home Values in the Area
Average Home Value in this Area
Purchase History
| Date | Buyer | Sale Price | Title Company |
|---|---|---|---|
| Bhayani Mansoor R | $340,000 | None Available | |
| Bhavsar Miten | $234,000 | None Available | |
| Livingston John M | $187,950 | -- |
Source: Public Records
Mortgage History
| Date | Status | Borrower | Loan Amount |
|---|---|---|---|
| Open | Bhayani Mansoor R | $272,000 | |
| Previous Owner | Bhavsar Miten | $187,200 | |
| Previous Owner | Livingston John M | $150,360 |
Source: Public Records
Tax History Compared to Growth
Tax History
| Year | Tax Paid | Tax Assessment Tax Assessment Total Assessment is a certain percentage of the fair market value that is determined by local assessors to be the total taxable value of land and additions on the property. | Land | Improvement |
|---|---|---|---|---|
| 2025 | $2,839 | $103,975 | $19,000 | $84,975 |
| 2024 | $2,839 | $83,750 | $12,250 | $71,500 |
| 2023 | $4,380 | $83,750 | $12,250 | $71,500 |
| 2022 | $4,280 | $83,750 | $12,250 | $71,500 |
| 2021 | $2,889 | $83,750 | $12,250 | $71,500 |
| 2020 | $2,462 | $60,800 | $12,250 | $48,550 |
| 2019 | $2,462 | $60,800 | $12,250 | $48,550 |
| 2018 | $2,462 | $60,800 | $12,250 | $48,550 |
| 2017 | $3,490 | $60,800 | $12,250 | $48,550 |
| 2016 | $2,069 | $47,350 | $0 | $0 |
| 2014 | $2,069 | $49,475 | $0 | $0 |
Source: Public Records
Map
Nearby Homes
- 10470 Ashfarm Way
- 10538 N Ashglen Cir
- 4530 Park Ridge Pkwy
- 4631 Pecan Harvest Dr
- 10442 Kensington Cir Unit 15
- 10445 Emmas Cir S
- 1573 Paso Fino Trail
- 4711 Carousel Ln
- 4824 Lyla Ln
- 4828 Lyla Ln
- 4849 Zander Ln
- 4845 Zander Ln
- 4597 Whisper Spring Dr
- 4844 Lyla Ln
- 4758 Carousel Ln
- 4766 Carousel Ln
- Anniston Plan at Lockwood
- Sloan Plan at Lockwood
- Hudson Plan at Lockwood
- Townsend Plan at Lockwood
- 10471 Aniston Way
- 10466 Ashfarm Way
- 10477 Aniston Way
- 10451 Aniston Way
- 4615 Park Side Cir
- 4635 Park Side Dr
- 10476 Ashfarm Way
- 10445 Aniston Way
- 10483 Aniston Way
- 4641 Park Side Dr
- 4609 Park Side Cir
- 10482 Ashfarm Way
- 4614 Park Ridge Pkwy
- 4645 Park Side Dr
- 4605 Park Side Dr
- 10486 Ashfarm Way
- 4605 Park Side Cir
- 10489 Aniston Way
- 10439 Aniston Way
- 4634 Park Ridge Pkwy