10465 W Briar Oaks Dr Unit 184 Stanton, CA 90680
West Anaheim NeighborhoodEstimated Value: $605,000 - $640,000
3
Beds
2
Baths
1,251
Sq Ft
$497/Sq Ft
Est. Value
About This Home
This home is located at 10465 W Briar Oaks Dr Unit 184, Stanton, CA 90680 and is currently estimated at $621,479, approximately $496 per square foot. 10465 W Briar Oaks Dr Unit 184 is a home located in Orange County with nearby schools including Hansen Elementary School, Orangeview Junior High, and Western High School.
Ownership History
Date
Name
Owned For
Owner Type
Purchase Details
Closed on
Dec 18, 2013
Sold by
Fujitani Laurie A
Bought by
Fujitani Laurie A and Laurie A Fujitani Trust
Current Estimated Value
Purchase Details
Closed on
Feb 10, 2012
Sold by
Fujitani Laurie A
Bought by
Fujitani Laurie A
Home Financials for this Owner
Home Financials are based on the most recent Mortgage that was taken out on this home.
Original Mortgage
$195,500
Outstanding Balance
$133,745
Interest Rate
3.86%
Mortgage Type
New Conventional
Estimated Equity
$487,734
Purchase Details
Closed on
Mar 30, 2009
Sold by
Fujitani Tracey M
Bought by
Fujitani Laurie A
Home Financials for this Owner
Home Financials are based on the most recent Mortgage that was taken out on this home.
Original Mortgage
$199,200
Interest Rate
5.17%
Mortgage Type
Purchase Money Mortgage
Purchase Details
Closed on
Mar 25, 2009
Sold by
Zapanta Jesus and Zapanta Rachelle
Bought by
Fujitani Laurie A
Home Financials for this Owner
Home Financials are based on the most recent Mortgage that was taken out on this home.
Original Mortgage
$199,200
Interest Rate
5.17%
Mortgage Type
Purchase Money Mortgage
Purchase Details
Closed on
Oct 24, 2007
Sold by
Zapanta Jesus and Zapanta Rachelle
Bought by
Zapanta Jesus and Zapanta Rachelle
Purchase Details
Closed on
Apr 5, 2006
Sold by
Zapanta Rachelle and Zapanta Jesus
Bought by
Zapanta Jesus and Zapanta Rachelle
Purchase Details
Closed on
Jun 24, 2005
Sold by
Ishqar Raed and Ishqair Carri
Bought by
Zapanta Rachelle and Zapanta Jesus
Home Financials for this Owner
Home Financials are based on the most recent Mortgage that was taken out on this home.
Original Mortgage
$333,000
Interest Rate
7.29%
Mortgage Type
Purchase Money Mortgage
Purchase Details
Closed on
Apr 15, 1999
Sold by
Teresa Scott and Teresa Theodore A
Bought by
Ishqair Carri and Ishqair Raed
Home Financials for this Owner
Home Financials are based on the most recent Mortgage that was taken out on this home.
Original Mortgage
$92,000
Interest Rate
6.92%
Mortgage Type
Stand Alone First
Purchase Details
Closed on
Jul 24, 1997
Sold by
Wilson Michael H and Wilson Nancy H
Bought by
Scott Teresa and Scott Theodore A
Home Financials for this Owner
Home Financials are based on the most recent Mortgage that was taken out on this home.
Original Mortgage
$95,618
Interest Rate
7.42%
Mortgage Type
FHA
Create a Home Valuation Report for This Property
The Home Valuation Report is an in-depth analysis detailing your home's value as well as a comparison with similar homes in the area
Home Values in the Area
Average Home Value in this Area
Purchase History
| Date | Buyer | Sale Price | Title Company |
|---|---|---|---|
| Fujitani Laurie A | -- | None Available | |
| Fujitani Laurie A | -- | Ticor Title | |
| Fujitani Laurie A | -- | Western Resources Title | |
| Fujitani Laurie A | $249,000 | Western Resources Title | |
| Zapanta Jesus | -- | None Available | |
| Zapanta Jesus | -- | Accommodation | |
| Zapanta Rachelle | $370,000 | Southland Title Corporation | |
| Ishqair Carri | $122,000 | North American Title Co | |
| Scott Teresa | $98,500 | Commonwealth Land Title |
Source: Public Records
Mortgage History
| Date | Status | Borrower | Loan Amount |
|---|---|---|---|
| Open | Fujitani Laurie A | $195,500 | |
| Closed | Fujitani Laurie A | $199,200 | |
| Previous Owner | Zapanta Rachelle | $333,000 | |
| Previous Owner | Ishqair Carri | $92,000 | |
| Previous Owner | Scott Teresa | $95,618 |
Source: Public Records
Tax History Compared to Growth
Tax History
| Year | Tax Paid | Tax Assessment Tax Assessment Total Assessment is a certain percentage of the fair market value that is determined by local assessors to be the total taxable value of land and additions on the property. | Land | Improvement |
|---|---|---|---|---|
| 2025 | $3,910 | $320,645 | $196,978 | $123,667 |
| 2024 | $3,910 | $314,358 | $193,115 | $121,243 |
| 2023 | $3,810 | $308,195 | $189,329 | $118,866 |
| 2022 | $3,734 | $302,152 | $185,616 | $116,536 |
| 2021 | $3,765 | $296,228 | $181,977 | $114,251 |
| 2020 | $3,713 | $293,191 | $180,111 | $113,080 |
| 2019 | $3,614 | $287,443 | $176,580 | $110,863 |
| 2018 | $3,562 | $281,807 | $173,117 | $108,690 |
| 2017 | $3,441 | $276,282 | $169,723 | $106,559 |
| 2016 | $3,425 | $270,865 | $166,395 | $104,470 |
| 2015 | $3,384 | $266,797 | $163,896 | $102,901 |
| 2014 | $3,219 | $261,571 | $160,685 | $100,886 |
Source: Public Records
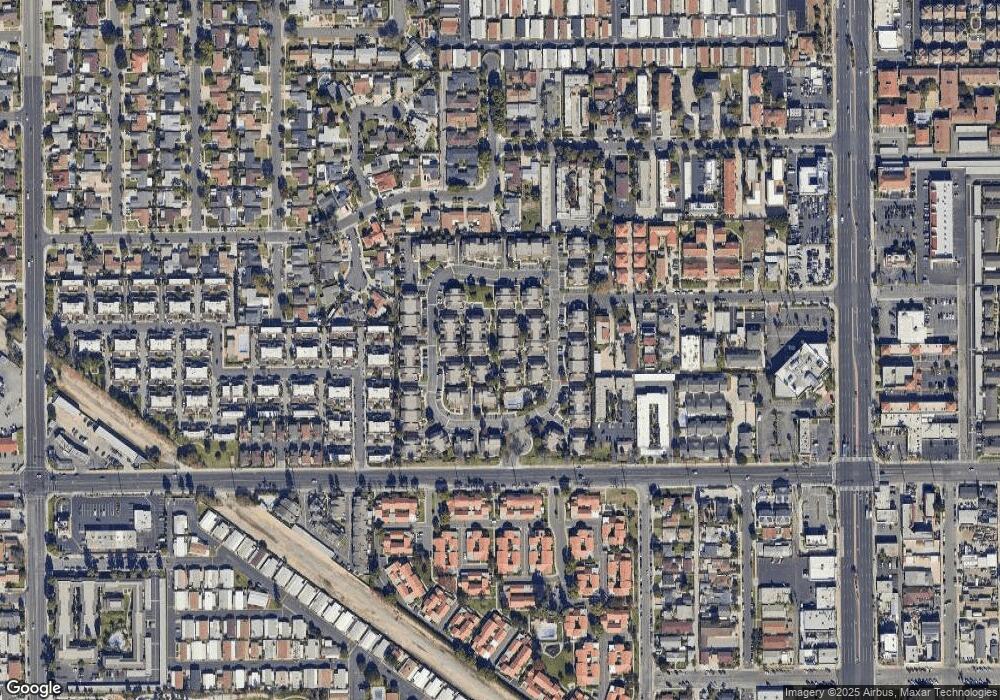
Map
Nearby Homes
- 10393 E Briar Oaks Dr Unit D
- 10552 Royal Oak Way
- 7652 Cerritos Ave
- 10626 Braeswood Way
- 7850 2nd St
- 10420 Vassar Way
- 10550 Western Ave
- 10550 Western Ave Unit 43
- 10550 Western Ave Unit 56
- 10550 Western Ave Unit 85
- 10550 Western Ave Unit 98
- 10531 Western Ave
- 10786 Mitchell Dr
- 3050 W Ball Rd Unit 171
- 3050 W Ball Rd Unit 115B
- 3050 W Ball Rd Unit 127
- 3050 W Ball Rd Unit 132
- 3050 W Ball Rd Unit 82
- 3050 W Ball Rd Unit 200
- 3050 W Ball Rd Unit 152
- 10465 W Briar Oaks Dr Unit C
- 10465 W Briar Oaks Dr Unit E
- 10465 W Briar Oaks Dr Unit D
- 10465 W Briar Oaks Dr Unit 185
- 10465 W Briar Oaks Dr Unit A
- 10465 W Briar Oaks Dr Unit 182
- 10465 W Briar Oaks Dr Unit 181
- 10485 W Briar Oaks Dr Unit C
- 10485 W Briar Oaks Dr Unit 188
- 10485 W Briar Oaks Dr Unit E
- 10485 W Briar Oaks Dr Unit A
- 10485 W Briar Oaks Dr Unit 189
- 10485 W Briar Oaks Dr Unit 186
- 10485 W Briar Oaks Dr Unit D
- 10452 W Briar Oaks Dr Unit B
- 10452 W Briar Oaks Dr Unit C
- 10452 W Briar Oaks Dr Unit 202
- 10452 W Briar Oaks Dr
- 10452 W Briar Oaks Dr Unit 201
- 10487 W Briar Oaks Dr