10467 287th Ave NW Zimmerman, MN 55398
Estimated Value: $312,000 - $351,000
3
Beds
2
Baths
936
Sq Ft
$351/Sq Ft
Est. Value
About This Home
This home is located at 10467 287th Ave NW, Zimmerman, MN 55398 and is currently estimated at $328,262, approximately $350 per square foot. 10467 287th Ave NW is a home located in Sherburne County with nearby schools including Princeton Intermediate School, Princeton Primary School, and Princeton Middle School.
Ownership History
Date
Name
Owned For
Owner Type
Purchase Details
Closed on
Sep 25, 2015
Sold by
Plys Anna
Bought by
Casler Trever J
Current Estimated Value
Home Financials for this Owner
Home Financials are based on the most recent Mortgage that was taken out on this home.
Original Mortgage
$178,571
Outstanding Balance
$142,237
Interest Rate
4.25%
Mortgage Type
FHA
Estimated Equity
$186,025
Purchase Details
Closed on
Sep 6, 2013
Sold by
Burdick Anne L and Burdick Joshua J
Bought by
Casler Trever J and Plys Anna
Home Financials for this Owner
Home Financials are based on the most recent Mortgage that was taken out on this home.
Original Mortgage
$174,591
Interest Rate
4.29%
Mortgage Type
New Conventional
Purchase Details
Closed on
May 29, 2002
Sold by
Hansen Construction Inc
Bought by
Burdick Joshua J and Burdick Anne L
Create a Home Valuation Report for This Property
The Home Valuation Report is an in-depth analysis detailing your home's value as well as a comparison with similar homes in the area
Home Values in the Area
Average Home Value in this Area
Purchase History
| Date | Buyer | Sale Price | Title Company |
|---|---|---|---|
| Casler Trever J | -- | Preferred Title | |
| Casler Trever J | $171,100 | Home Security Abstract & Tit | |
| Burdick Joshua J | $152,200 | -- |
Source: Public Records
Mortgage History
| Date | Status | Borrower | Loan Amount |
|---|---|---|---|
| Open | Casler Trever J | $178,571 | |
| Previous Owner | Casler Trever J | $174,591 |
Source: Public Records
Tax History Compared to Growth
Tax History
| Year | Tax Paid | Tax Assessment Tax Assessment Total Assessment is a certain percentage of the fair market value that is determined by local assessors to be the total taxable value of land and additions on the property. | Land | Improvement |
|---|---|---|---|---|
| 2025 | $2,314 | $299,800 | $101,300 | $198,500 |
| 2024 | $2,292 | $291,100 | $92,600 | $198,500 |
| 2023 | $2,224 | $290,600 | $87,800 | $202,800 |
| 2022 | $1,960 | $278,300 | $79,000 | $199,300 |
| 2020 | $1,728 | $195,700 | $39,100 | $156,600 |
| 2019 | $1,620 | $175,500 | $36,300 | $139,200 |
| 2018 | $1,534 | $162,800 | $33,800 | $129,000 |
| 2017 | $1,372 | $149,200 | $32,700 | $116,500 |
| 2016 | $1,304 | $138,100 | $28,600 | $109,500 |
| 2015 | $1,178 | $105,100 | $22,100 | $83,000 |
| 2014 | $1,016 | $94,300 | $18,800 | $75,500 |
| 2013 | -- | $82,300 | $18,000 | $64,300 |
Source: Public Records
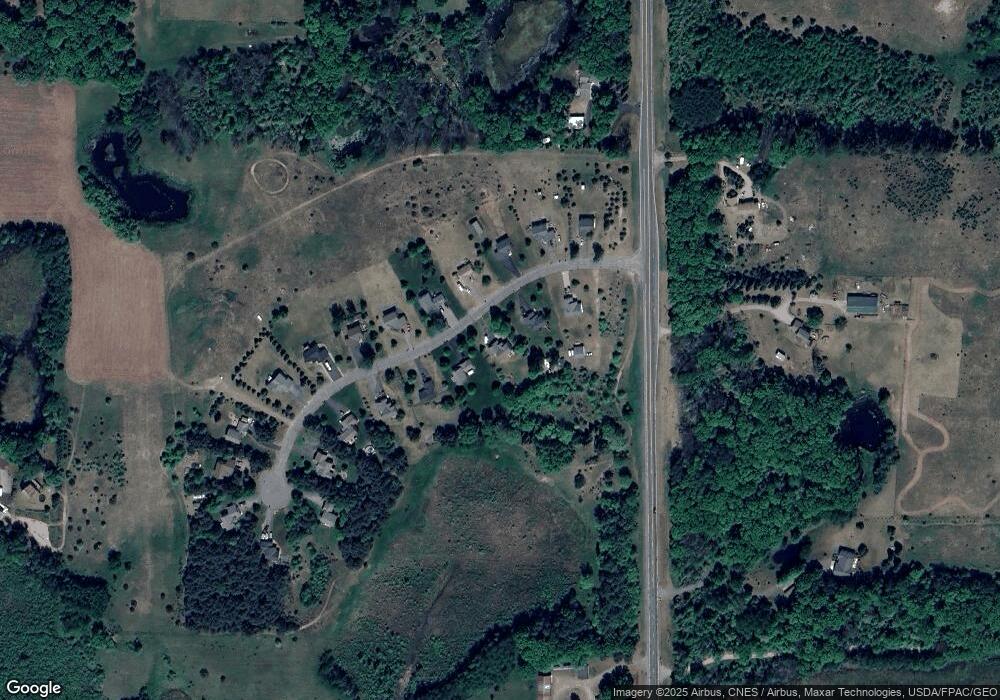
Map
Nearby Homes
- 10604 273rd Ave NW
- 27755 Blue Lake Dr NW
- 28008 116th St NW
- XXXX 283rd Ave NW
- 28945 120th St
- TBD 116th St NW
- 9839 301st Ave
- 13282 295th Ave NW
- 000 Tiger St NW
- Lot 4 Tiger St NW
- Lot 2 Tiger St NW
- 9055 295th Ave NW
- XXXX 280th Ave NW
- TBD 280th Ave NW
- 12314 283rd Ave NW
- 28840 Highway 169
- 29995 Baugh St NW
- 27010 117th St NW
- 28308 125th St NW
- 30863 105th St
- 10443 287th Ave NW
- 10483 287th Ave NW
- 10425 287th Ave NW
- 10501 287th Ave NW
- 10480 287th Ave NW
- 10442 287th Ave NW
- 10500 287th Ave NW
- 10432 287th Ave NW
- 10526 287th Ave NW
- 10418 287th Ave NW
- 10551 287th Ave NW
- 10575 287th Ave NW
- 10558 287th Ave NW
- 10593 287th Ave NW
- 10576 287th Ave NW
- 28715 104th St NW
- 28724 104th St NW
- 10590 287th Ave NW
- 10598 287th Ave NW
- 10594 287th Ave NW