10469 Oak Grove Dr Breezy Point, MN 56472
Estimated Value: $450,000 - $575,052
2
Beds
2
Baths
896
Sq Ft
$574/Sq Ft
Est. Value
About This Home
This home is located at 10469 Oak Grove Dr, Breezy Point, MN 56472 and is currently estimated at $514,013, approximately $573 per square foot. 10469 Oak Grove Dr is a home located in Crow Wing County with nearby schools including Eagle View Elementary School, Pequot Lakes Middle School, and Pequot Lakes Senior High School.
Ownership History
Date
Name
Owned For
Owner Type
Purchase Details
Closed on
Aug 25, 2017
Sold by
Holst Larry R and Holst Marinell S
Bought by
Kruckeberg Todd B
Current Estimated Value
Purchase Details
Closed on
Aug 1, 2007
Sold by
Polusny George G and Polusny Karen J
Bought by
Holst Larry R and Holst Marinell S
Purchase Details
Closed on
Nov 1, 2002
Sold by
Hillman John and Hillman Jennifer
Bought by
Polusny George and Polusny Karen
Purchase Details
Closed on
Aug 1, 2001
Sold by
Schiller William S
Bought by
Hillman John and Hillman Jen
Purchase Details
Closed on
Jul 1, 1999
Sold by
Nagel Gordon A and Nagel J
Bought by
Schiller William S
Purchase Details
Closed on
Nov 1, 1993
Sold by
Romanowski Thom
Bought by
Nagel Gordon A
Create a Home Valuation Report for This Property
The Home Valuation Report is an in-depth analysis detailing your home's value as well as a comparison with similar homes in the area
Home Values in the Area
Average Home Value in this Area
Purchase History
| Date | Buyer | Sale Price | Title Company |
|---|---|---|---|
| Kruckeberg Todd B | $257,500 | -- | |
| Holst Larry R | $281,000 | -- | |
| Polusny George | $219,000 | -- | |
| Hillman John | $199,900 | -- | |
| Schiller William S | $127,500 | -- | |
| Nagel Gordon A | $64,900 | -- |
Source: Public Records
Tax History Compared to Growth
Tax History
| Year | Tax Paid | Tax Assessment Tax Assessment Total Assessment is a certain percentage of the fair market value that is determined by local assessors to be the total taxable value of land and additions on the property. | Land | Improvement |
|---|---|---|---|---|
| 2025 | $3,872 | $495,800 | $353,200 | $142,600 |
| 2024 | $3,872 | $487,600 | $357,600 | $130,000 |
| 2023 | $3,254 | $395,100 | $279,300 | $115,800 |
| 2022 | $2,984 | $376,600 | $261,000 | $115,600 |
| 2021 | $2,962 | $265,500 | $186,200 | $79,300 |
| 2020 | $2,780 | $261,400 | $186,200 | $75,200 |
| 2019 | $2,630 | $238,900 | $169,600 | $69,300 |
| 2018 | $2,486 | $232,700 | $169,600 | $63,100 |
| 2017 | $2,452 | $218,300 | $161,300 | $57,000 |
| 2016 | $2,464 | $210,000 | $156,300 | $53,700 |
| 2015 | $2,686 | $224,700 | $172,400 | $52,300 |
| 2014 | $1,327 | $216,600 | $163,200 | $53,400 |
Source: Public Records
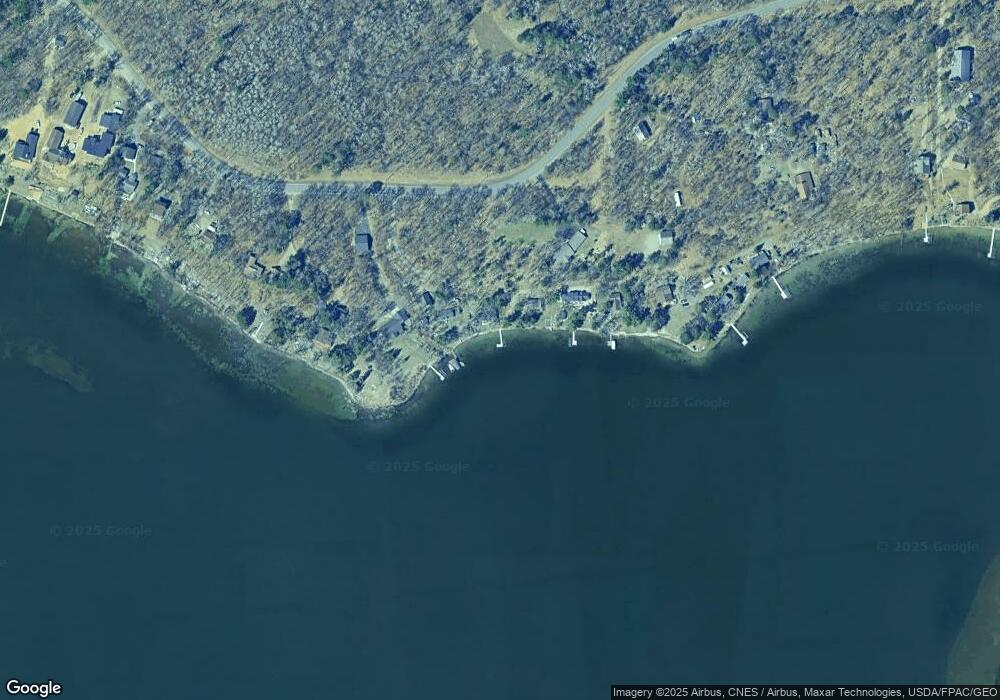
Map
Nearby Homes
- 10313 Ossawinnamakee Rd
- 10422 Ossawinnamakee Rd
- 0000 Violet Ln
- 000 Violet Ln
- TBD Peony Ln
- Lots 100 & 101 TBD Orchid Ln
- TBD Dell Marie Place
- TBD Strawberry Lake Rd
- 32433 Cedar St
- 33585 County Road 39
- tbd Cedar St
- 8971 Dellwood Dr
- TBD Dog Leg Dr
- XXX Dog Leg Dr
- Lot 15 Cedar St
- TBD Lot 14 1st Street Cir
- TBD 1st Street Cir
- 33249 Winnamakee Shores Rd
- TBD Lot 49, Blk 1 Huron Cir
- XXX 3rd St
- 10069 Oak Grove Dr
- 10069 10069 Oak Grove Dr
- 10673 Oak Grove Dr
- 9989 Ossawinnamakee Rd
- 9903 Ossawinnamakee Rd
- 10759 Oak Grove Dr
- 10803 Oak Grove Dr
- 10927 Oak Grove Dr
- 9871 Ossawinnamakee Rd
- 9865 Ossawinnamakee Rd
- 10981 Oak Grove Dr
- 10989 Oak Grove Dr
- 10989 Oak Grove Dr
- 9833 Ossawinnamakee Rd
- 10115 Ossawinnamakee Rd
- 9825 Ossawinnamakee Rd
- 9825 Ossawinnamakee Rd
- 33216 Shadow Trail
- 9819 Ossawinnamakee Rd
- LOT 5 Ossawinamakee Rd