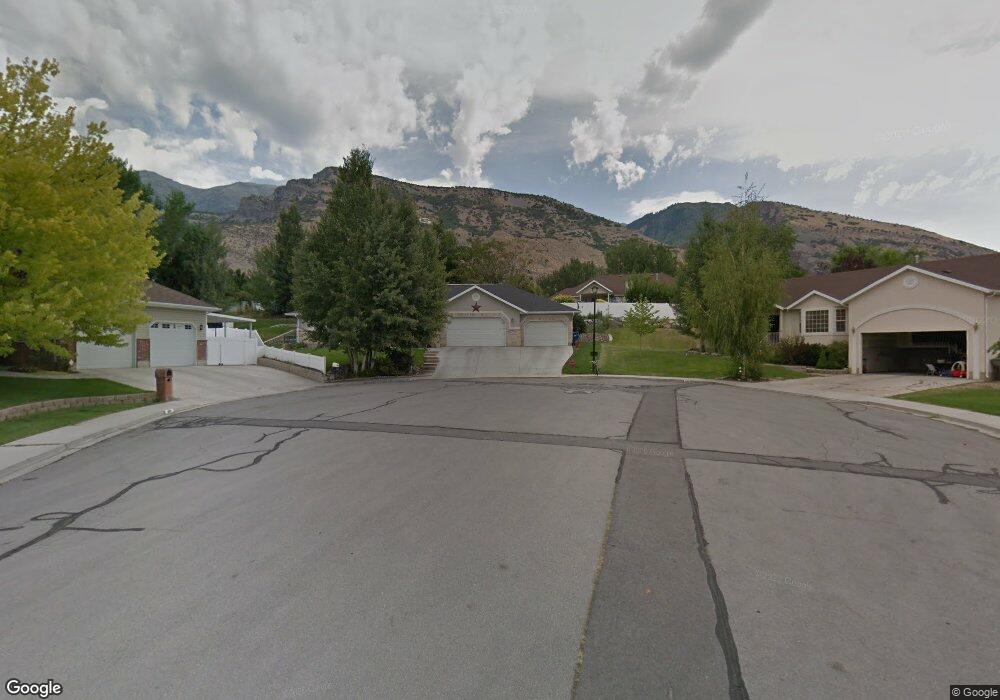
1047 E 360 N Pleasant Grove, UT 84062
Estimated Value: $705,000 - $784,008
5
Beds
2
Baths
3,780
Sq Ft
$200/Sq Ft
Est. Value
About This Home
This home is located at 1047 E 360 N, Pleasant Grove, UT 84062 and is currently estimated at $755,669, approximately $199 per square foot. 1047 E 360 N is a home located in Utah County with nearby schools including Grovecrest Elementary School, Pleasant Grove Junior High School, and Pleasant Grove High School.
Ownership History
Date
Name
Owned For
Owner Type
Purchase Details
Closed on
Oct 7, 2025
Sold by
Crookston John V
Bought by
John Vernon Crookston Trust and Crookston
Current Estimated Value
Purchase Details
Closed on
Sep 11, 2025
Sold by
Crookston John V
Bought by
John Vernon Crookston Trust and Crookston
Purchase Details
Closed on
Feb 17, 2006
Sold by
Harris Richard Wayne and Harris Richard W
Bought by
Crookston John
Home Financials for this Owner
Home Financials are based on the most recent Mortgage that was taken out on this home.
Original Mortgage
$57,800
Interest Rate
6.08%
Mortgage Type
Stand Alone Second
Purchase Details
Closed on
Oct 8, 1996
Sold by
Harris Gordon K and Harris Carol T
Bought by
Harris Richard W and Harris Jeanette Suzanne
Create a Home Valuation Report for This Property
The Home Valuation Report is an in-depth analysis detailing your home's value as well as a comparison with similar homes in the area
Home Values in the Area
Average Home Value in this Area
Purchase History
| Date | Buyer | Sale Price | Title Company |
|---|---|---|---|
| John Vernon Crookston Trust | -- | None Listed On Document | |
| John Vernon Crookston Trust | -- | None Listed On Document | |
| Crookston John | -- | Guardian Title Company Of U | |
| Harris Richard W | -- | -- | |
| Harris Gordon K | -- | -- | |
| Harris Gordon K | -- | -- |
Source: Public Records
Mortgage History
| Date | Status | Borrower | Loan Amount |
|---|---|---|---|
| Previous Owner | Crookston John | $57,800 | |
| Previous Owner | Crookston John | $231,200 |
Source: Public Records
Tax History
| Year | Tax Paid | Tax Assessment Tax Assessment Total Assessment is a certain percentage of the fair market value that is determined by local assessors to be the total taxable value of land and additions on the property. | Land | Improvement |
|---|---|---|---|---|
| 2025 | $2,890 | $382,855 | -- | -- |
| 2024 | $2,890 | $344,850 | $0 | $0 |
| 2023 | $2,820 | $344,520 | $0 | $0 |
| 2022 | $2,828 | $343,750 | $0 | $0 |
| 2021 | $2,460 | $455,300 | $175,700 | $279,600 |
| 2020 | $2,378 | $431,500 | $162,700 | $268,800 |
| 2019 | $2,259 | $424,000 | $155,200 | $268,800 |
| 2018 | $2,106 | $373,700 | $140,000 | $233,700 |
| 2017 | $2,116 | $199,925 | $0 | $0 |
| 2016 | $2,014 | $183,700 | $0 | $0 |
| 2015 | $1,941 | $167,640 | $0 | $0 |
| 2014 | $1,830 | $156,530 | $0 | $0 |
Source: Public Records
Map
Nearby Homes
- 1039 E 360 N
- 401 Canyon View Dr
- 375 Canyon View Dr
- 1046 E 360 N
- 1026 E 440 N
- 442 N 1030 E
- 1036 E 360 N
- 353 Canyon View Ln
- 419 Canyon View Dr
- 353 Canyon View Dr
- 997 E 360 N
- 1012 E 440 N
- 998 E 360 N
- 384 Canyon View Dr
- 354 Canyon View Dr
- 384 Canyon View Ln
- 1062 E 490 N
- 1037 E 290 N
- 1042 E 490 N
- 1049 E 290 N
Your Personal Tour Guide
Ask me questions while you tour the home.