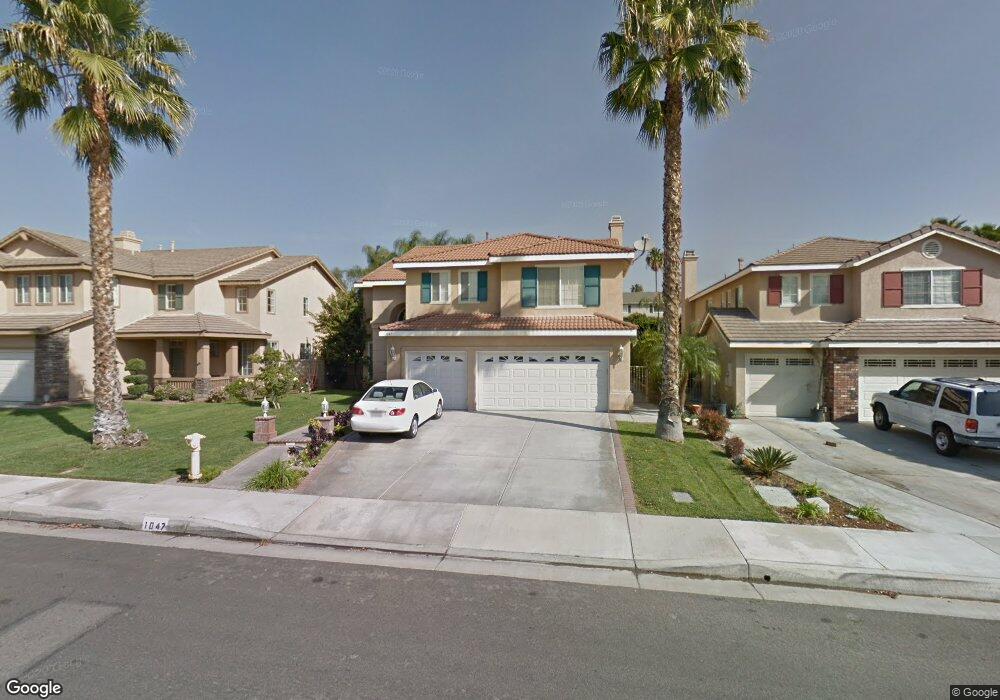
1047 E Deerfield St Ontario, CA 91761
Ontario Ranch NeighborhoodEstimated Value: $816,000 - $946,000
4
Beds
3
Baths
3,064
Sq Ft
$290/Sq Ft
Est. Value
About This Home
This home is located at 1047 E Deerfield St, Ontario, CA 91761 and is currently estimated at $888,610, approximately $290 per square foot. 1047 E Deerfield St is a home located in San Bernardino County with nearby schools including Liberty Elementary School, Woodcrest Junior High, and Chino High School.
Ownership History
Date
Name
Owned For
Owner Type
Purchase Details
Closed on
May 28, 2013
Sold by
Adnan Mohammad
Bought by
Haque Mohammad Burhanul and Haque Farrukh J
Current Estimated Value
Purchase Details
Closed on
Jun 10, 2010
Sold by
Haque Mohammad Burhanul
Bought by
Adnan Mohammad
Home Financials for this Owner
Home Financials are based on the most recent Mortgage that was taken out on this home.
Original Mortgage
$250,000
Interest Rate
4.99%
Mortgage Type
New Conventional
Purchase Details
Closed on
Oct 18, 2005
Sold by
Haque Farrukh Jamil
Bought by
Haque Mohammad Burhanul
Purchase Details
Closed on
Feb 10, 2003
Sold by
Haque Mohammad and Haque Adnan Asifa
Bought by
Adnan Mohammed
Purchase Details
Closed on
Jun 2, 1999
Sold by
Ontario 120/Af Xiv Ltd
Bought by
Haque Mohammad
Home Financials for this Owner
Home Financials are based on the most recent Mortgage that was taken out on this home.
Original Mortgage
$171,192
Interest Rate
6.84%
Mortgage Type
Stand Alone First
Create a Home Valuation Report for This Property
The Home Valuation Report is an in-depth analysis detailing your home's value as well as a comparison with similar homes in the area
Home Values in the Area
Average Home Value in this Area
Purchase History
| Date | Buyer | Sale Price | Title Company |
|---|---|---|---|
| Haque Mohammad Burhanul | $290,000 | Lawyers Title Company | |
| Adnan Mohammad | -- | Nations Title Company | |
| Haque Mohammad Burhanul | -- | -- | |
| Adnan Mohammad | -- | -- | |
| Adnan Mohammed | -- | Ticor Title Co | |
| Haque Mohammad | $214,000 | Fidelity National Title Co |
Source: Public Records
Mortgage History
| Date | Status | Borrower | Loan Amount |
|---|---|---|---|
| Previous Owner | Adnan Mohammad | $250,000 | |
| Previous Owner | Haque Mohammad | $171,192 | |
| Closed | Haque Mohammad Burhanul | $0 |
Source: Public Records
Tax History
| Year | Tax Paid | Tax Assessment Tax Assessment Total Assessment is a certain percentage of the fair market value that is determined by local assessors to be the total taxable value of land and additions on the property. | Land | Improvement |
|---|---|---|---|---|
| 2025 | $5,558 | $492,571 | $172,400 | $320,171 |
| 2024 | $5,410 | $482,913 | $169,020 | $313,893 |
| 2023 | $5,260 | $473,444 | $165,706 | $307,738 |
| 2022 | $5,226 | $464,161 | $162,457 | $301,704 |
| 2021 | $5,124 | $455,060 | $159,272 | $295,788 |
| 2020 | $5,058 | $450,394 | $157,639 | $292,755 |
| 2019 | $4,971 | $441,563 | $154,548 | $287,015 |
| 2018 | $4,861 | $432,905 | $151,518 | $281,387 |
| 2017 | $4,774 | $424,417 | $148,547 | $275,870 |
| 2016 | $4,463 | $416,095 | $145,634 | $270,461 |
| 2015 | $4,374 | $409,844 | $143,446 | $266,398 |
| 2014 | $4,288 | $401,816 | $140,636 | $261,180 |
Source: Public Records
Map
Nearby Homes
- 2644 S Cucamonga Ave
- 683 E Joseph Privado
- 665 E Riverside Dr Unit 3
- 619 E Joseph Privado
- 2431 S Marigold Place
- 2408 S Taylor Place
- 4315 S Grasly Paseo
- 0 Vineyard Unit CV25067044
- 1528 1538 W Holt
- 1305 W North Pinecrest
- 1426 E Tam o Shanter St
- 1468 E Merion Ct
- 2413 S Parco Ave
- 513 E Fairfield Ct
- 2410 S Sandpiper Place
- 2424 S Lake Ave
- 2300 S Sultana Ave Unit 298
- 2300 S Sultana Ave Unit 286
- 2300 S Sultana Ave Unit 256
- 2300 S Sultana Ave Unit 206
- 1039 E Deerfield St
- 1055 E Deerfield St
- 1031 E Deerfield St
- 1014 E Saint Andrews St
- 1020 E Saint Andrews St
- 1063 E Deerfield St
- 1008 E Saint Andrews St
- 1026 E Saint Andrews St
- 1023 E Deerfield St
- 1048 E Deerfield St
- 1040 E Deerfield St
- 1056 E Deerfield St
- 1002 E Saint Andrews St
- 1032 E Saint Andrews St
- 1032 E Deerfield St
- 1071 E Deerfield St
- 1024 E Deerfield St
- 950 E Saint Andrews St
- 1038 E Saint Andrews St
- 2831 S Holmes Ave
Your Personal Tour Guide
Ask me questions while you tour the home.