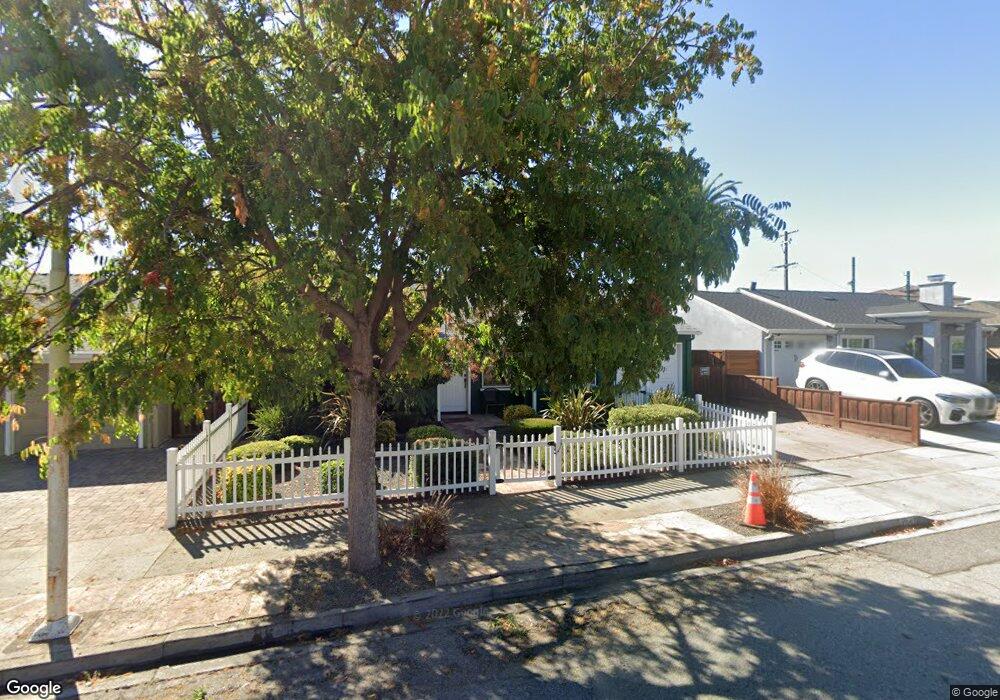
1047 Inverness Dr San Carlos, CA 94070
Clearfield Park NeighborhoodEstimated Value: $1,246,000 - $1,451,000
2
Beds
1
Bath
820
Sq Ft
$1,641/Sq Ft
Est. Value
About This Home
This home is located at 1047 Inverness Dr, San Carlos, CA 94070 and is currently estimated at $1,345,625, approximately $1,641 per square foot. 1047 Inverness Dr is a home located in San Mateo County with nearby schools including Arundel Elementary School, Tierra Linda Middle School, and Carlmont High School.
Ownership History
Date
Name
Owned For
Owner Type
Purchase Details
Closed on
Jan 24, 2025
Sold by
Race Family Trust and Race Pamela Sue
Bought by
Southwest Investment Funds Llc
Current Estimated Value
Purchase Details
Closed on
Dec 20, 2018
Sold by
Race Harrison H and Race Lois K
Bought by
Race Harrison H and The Race Family Trust
Home Financials for this Owner
Home Financials are based on the most recent Mortgage that was taken out on this home.
Original Mortgage
$1,987,500
Interest Rate
4.9%
Mortgage Type
Stand Alone First
Purchase Details
Closed on
Oct 19, 2012
Sold by
Race Harrison H and Race Lois K
Bought by
Race Harrison H and Race Lois K
Home Financials for this Owner
Home Financials are based on the most recent Mortgage that was taken out on this home.
Original Mortgage
$802,500
Interest Rate
3.5%
Mortgage Type
Reverse Mortgage Home Equity Conversion Mortgage
Purchase Details
Closed on
Oct 16, 1997
Sold by
Race Harrison H and Kay Lois
Bought by
Race Harrison H and Race Lois K
Create a Home Valuation Report for This Property
The Home Valuation Report is an in-depth analysis detailing your home's value as well as a comparison with similar homes in the area
Home Values in the Area
Average Home Value in this Area
Purchase History
| Date | Buyer | Sale Price | Title Company |
|---|---|---|---|
| Southwest Investment Funds Llc | $1,241,000 | First American Title | |
| Race Harrison H | -- | Fnc Title Services Llc | |
| Race Harrison H | -- | Placer Title Company | |
| Race Harrison H | -- | -- |
Source: Public Records
Mortgage History
| Date | Status | Borrower | Loan Amount |
|---|---|---|---|
| Previous Owner | Race Harrison H | $1,987,500 | |
| Previous Owner | Race Harrison H | $802,500 |
Source: Public Records
Tax History Compared to Growth
Tax History
| Year | Tax Paid | Tax Assessment Tax Assessment Total Assessment is a certain percentage of the fair market value that is determined by local assessors to be the total taxable value of land and additions on the property. | Land | Improvement |
|---|---|---|---|---|
| 2025 | $3,943 | $227,854 | $145,007 | $82,847 |
| 2023 | $3,943 | $219,008 | $139,377 | $79,631 |
| 2022 | $3,742 | $214,715 | $136,645 | $78,070 |
| 2021 | $3,654 | $210,506 | $133,966 | $76,540 |
| 2020 | $3,578 | $208,349 | $132,593 | $75,756 |
| 2019 | $3,503 | $204,265 | $129,994 | $74,271 |
| 2018 | $3,393 | $200,261 | $127,446 | $72,815 |
| 2017 | $3,315 | $196,336 | $124,948 | $71,388 |
| 2016 | $3,210 | $192,488 | $122,499 | $69,989 |
| 2015 | $3,200 | $189,597 | $120,659 | $68,938 |
| 2014 | $3,063 | $185,884 | $118,296 | $67,588 |
Source: Public Records
Map
Nearby Homes
- 520 El Camino Real Unit 307
- 520 El Camino Real Unit 201
- 222 Laurel St Unit 109
- 560 El Camino Real Unit 404
- 560 El Camino Real Unit 206
- 180 Elm St
- 64 Laurel St
- 1047 Cherry St
- 657 Walnut St Unit 301
- 7 Chestnut St
- 1501 Cherry St Unit 410
- 300 Manzanita Ave
- 728 Elm St Unit 205
- 1597 Molitor Rd
- 141 Hillcrest Rd
- 58 Hillcrest Rd
- 656 Cedar St Unit 3
- 1667 San Carlos Ave Unit 301
- 782 Elm St Unit C
- 1555 Cherry St Unit 12
- 1043 Inverness Dr
- 1051 Inverness Dr
- 1055 Inverness Dr
- 1048 Sylvan Dr
- 1044 Sylvan Dr
- 1052 Sylvan Dr Unit Cottage In-Law
- 1052 Sylvan Dr
- 1040 Sylvan Dr
- 1056 Sylvan Dr
- 1035 Inverness Dr
- 333 Old County Rd Unit Studio
- 333 Old County Rd
- 1052 Inverness Dr
- 1044 Inverness Dr
- 1036 Sylvan Dr
- 1056 Inverness Dr
- 349 Old County Rd
- 1040 Inverness Dr
- 1031 Inverness Dr
- 317 Old County Rd