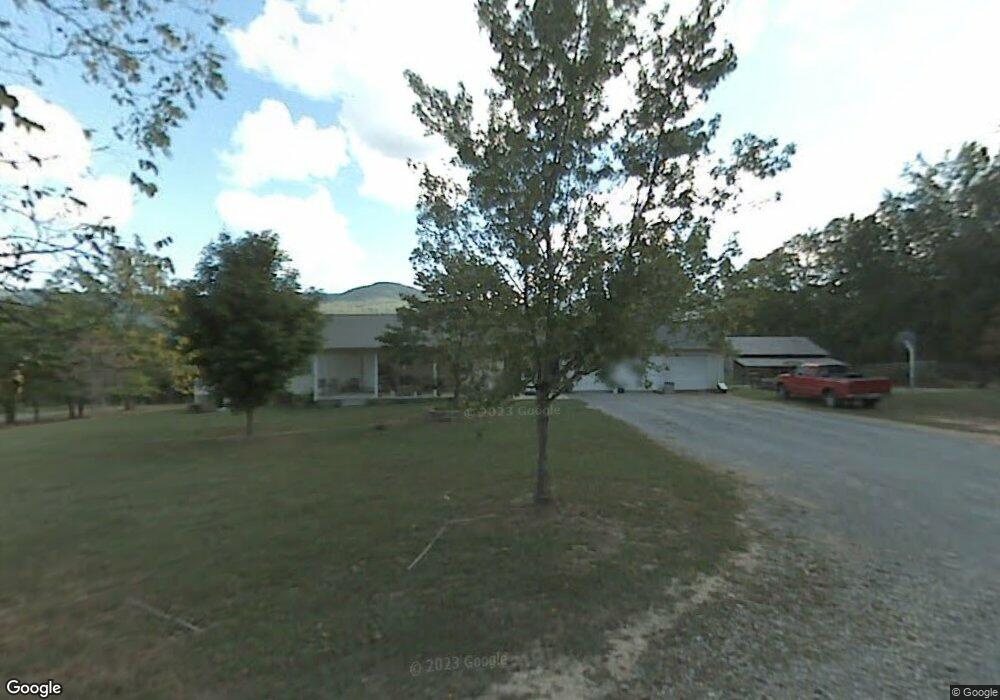
1047 Jack Smith Rd Dunlap, TN 37327
Estimated Value: $240,000 - $385,000
Studio
2
Baths
2,052
Sq Ft
$161/Sq Ft
Est. Value
About This Home
This home is located at 1047 Jack Smith Rd, Dunlap, TN 37327 and is currently estimated at $329,547, approximately $160 per square foot. 1047 Jack Smith Rd is a home located in Sequatchie County with nearby schools including Griffith Elementary School, Sequatchie County Middle School, and Sequatchie County High School.
Ownership History
Date
Name
Owned For
Owner Type
Purchase Details
Closed on
Jun 3, 2025
Sold by
Romeo Joseph P and Romeo Carly D
Bought by
Friedman Robert and Wyant Michelle
Current Estimated Value
Purchase Details
Closed on
Aug 8, 2012
Sold by
Brooks Mark W
Bought by
Farley Gary and Farley Peggy
Purchase Details
Closed on
Mar 19, 1999
Sold by
James Rollins and James Tammy G
Bought by
Kelly Peggy L
Purchase Details
Closed on
Apr 14, 1998
Bought by
Rollins James & Wife Tammy % Suntrust Mortgag
Purchase Details
Closed on
Sep 30, 1988
Bought by
Seals Michael D and Wife Annette
Create a Home Valuation Report for This Property
The Home Valuation Report is an in-depth analysis detailing your home's value as well as a comparison with similar homes in the area
Home Values in the Area
Average Home Value in this Area
Purchase History
| Date | Buyer | Sale Price | Title Company |
|---|---|---|---|
| Friedman Robert | $230,000 | Title Guaranty & Trust | |
| Farley Gary | $30,000 | -- | |
| Kelly Peggy L | $115,000 | -- | |
| Rollins James & Wife Tammy % Suntrust Mortgag | $112,000 | -- | |
| Seals Michael D | $6,000 | -- |
Source: Public Records
Tax History
| Year | Tax Paid | Tax Assessment Tax Assessment Total Assessment is a certain percentage of the fair market value that is determined by local assessors to be the total taxable value of land and additions on the property. | Land | Improvement |
|---|---|---|---|---|
| 2025 | $1,192 | $64,925 | $7,325 | $57,600 |
| 2024 | $1,192 | $64,925 | $7,325 | $57,600 |
| 2023 | $1,192 | $64,925 | $7,325 | $57,600 |
| 2022 | $926 | $37,925 | $3,725 | $34,200 |
| 2021 | $926 | $37,925 | $3,725 | $34,200 |
| 2020 | $926 | $37,925 | $3,725 | $34,200 |
| 2019 | $926 | $37,925 | $3,725 | $34,200 |
| 2018 | $926 | $37,925 | $3,725 | $34,200 |
| 2017 | $880 | $36,025 | $3,725 | $32,300 |
| 2016 | $940 | $36,600 | $4,425 | $32,175 |
| 2015 | $940 | $36,600 | $4,425 | $32,175 |
| 2014 | $940 | $36,600 | $4,425 | $32,175 |
Source: Public Records
Map
Nearby Homes
- 415 Neergaard Ln
- 55 River Ridge Dr
- 495 Lower East Valley Rd
- 123 River Ridge Dr
- 122 River Ridge Dr
- Lot 106 Pinnacle Point Ln
- Lot 105 Pinnacle Point Ln
- 101 Pinnacle Point Ln
- 120 River Ridge Dr
- Lot 112 Pinnacle Pt Ln
- Lot 35 River Ridge Dr
- 0 Dry Branch Way
- 371 Lumina Ln
- 35 River Ridge Dr
- 100 River Dr
- 121 River Dr
- 63 River Dr
- 125 River Dr
- 48 River Dr
- 50 River Dr
- 1034 Jack Smith Rd
- 957 Jack Smith Rd
- 1049 Jack Smith Rd
- 847 Jack Smith Rd
- 1289 Boston Town Rd
- 1205 Boston Town Rd
- 679 Jack Smith Rd
- 1192 Boston Town Rd
- 1351 Knotty Pine Rd
- 631 Jack Smith Rd
- 740 Jack Smith Rd
- 123a Neergaard Ln
- 143 Boston Hill Rd
- 589 Jack Smith Rd
- 554 Jack Smith Rd
- 1046 Boston Town Rd
- 1343 Knotty Pine Rd
- 76 Bradley Acres Ln
- 498 Jack Smith Rd
- 0 Knotty Pine Rd Unit RTC2987423