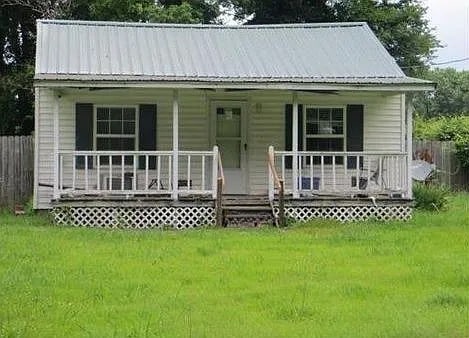
1047 Perry Switch Rd Jackson, TN 38301
Estimated payment $531/month
Highlights
- Deck
- 2 Fireplaces
- Ducts Professionally Air-Sealed
- Wood Flooring
- No HOA
- Accessible Doors
About This Home
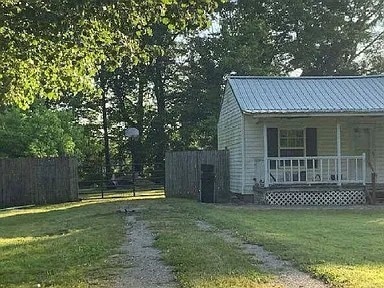
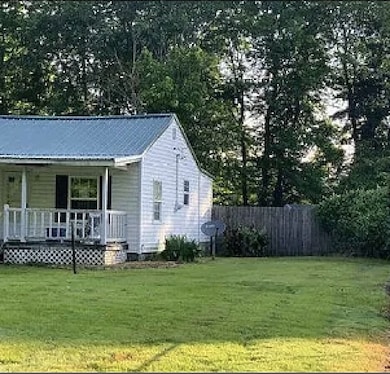
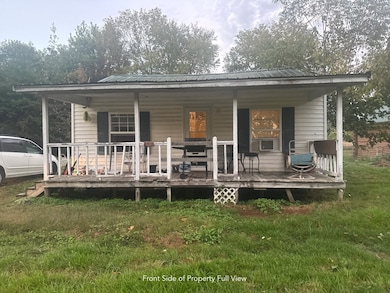
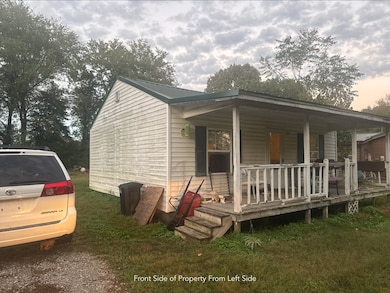
This 1951 gem offers the perfect blend of peace, privacy, and possibility! Nestled on a spacious 0.34-acre lot, this two-bedroom, one-bath home features a durable metal roof, flexible living spaces, and the rare bonus of two master suites—ideal for multigenerational living or creative redesign.
Step inside and imagine the possibilities: with a little cosmetic updating and new flooring, this charming cottage could become your dream home, weekend retreat, or next profitable investment. The open layout and large lot offer plenty of room to expand or add your personal touch.
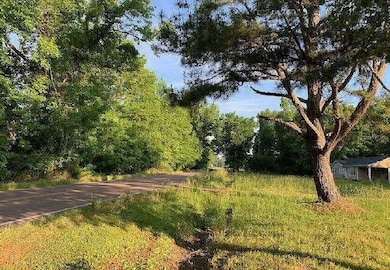
Located just minutes from Jackson, you’ll enjoy the quiet of the countryside without sacrificing convenience. Whether you’re a homeowner with vision or an investor searching for your next opportunity, this property is packed with potential—and it’s waiting for you to make it shine.
Don’t miss out on this affordable property with incredible upside.
Listing Agent
Sell Your Home Services, LLC Brokerage Phone: 8882193009 License #358681 Listed on: 10/09/2025
Home Details
Home Type
- Single Family
Est. Annual Taxes
- $243
Year Built
- Built in 1951
Home Design
- Aluminum Roof
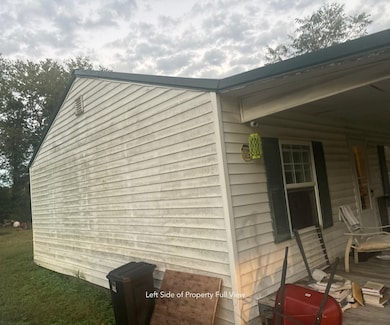
- Wood Siding
- Aluminum Siding
Interior Spaces
- 676 Sq Ft Home
- Property has 1 Level
- Ceiling Fan
- 2 Fireplaces
- Combination Dining and Living Room
- Interior Storage Closet
- Wood Flooring
- Finished Basement
- Basement Fills Entire Space Under The House
- Built-In Electric Oven
Bedrooms and Bathrooms
- 2 Main Level Bedrooms
- 1 Full Bathroom
Parking
- 5 Open Parking Spaces
- 5 Parking Spaces
- Driveway
Accessible Home Design
- Accessible Doors
- Accessible Entrance
Schools
- South Elementary School
- West-Bemis Middle School
- South Side High School
Utilities
- Ducts Professionally Air-Sealed
- Cooling System Mounted To A Wall/Window
- Central Heating
- Water Purifier
Additional Features
- Deck
- 14,810 Sq Ft Lot
Community Details
- No Home Owners Association
Listing and Financial Details
- Assessor Parcel Number 108 01800 000
Map
Tax History
| Year | Tax Paid | Tax Assessment Tax Assessment Total Assessment is a certain percentage of the fair market value that is determined by local assessors to be the total taxable value of land and additions on the property. | Land | Improvement |
|---|---|---|---|---|
| 2025 | $243 | $12,975 | $1,275 | $11,700 |
| 2024 | $243 | $12,975 | $1,275 | $11,700 |
| 2022 | $243 | $12,975 | $1,275 | $11,700 |
| 2021 | $142 | $6,025 | $1,125 | $4,900 |
| 2020 | $142 | $6,025 | $1,125 | $4,900 |
| 2019 | $142 | $6,025 | $1,125 | $4,900 |
| 2018 | $142 | $6,025 | $1,125 | $4,900 |
| 2017 | $138 | $5,650 | $1,125 | $4,525 |
| 2016 | $125 | $5,800 | $1,125 | $4,675 |
| 2015 | $125 | $5,800 | $1,125 | $4,675 |
| 2014 | $125 | $5,800 | $1,125 | $4,675 |
Property History
| Date | Event | Price | List to Sale | Price per Sq Ft |
|---|---|---|---|---|
| 10/09/2025 10/09/25 | For Sale | $95,000 | -- | $141 / Sq Ft |
Purchase History
| Date | Type | Sale Price | Title Company |
|---|---|---|---|
| Special Warranty Deed | $18,300 | Accommodation | |
| Trustee Deed | $23,100 | None Available | |
| Trustee Deed | $23,100 | None Listed On Document | |
| Warranty Deed | $34,600 | -- | |
| Deed | $15,000 | -- | |
| Deed | $11,867 | -- | |
| Deed | -- | -- | |
| Warranty Deed | $28,500 | -- | |
| Deed | -- | -- |
Source: Realtracs
MLS Number: 3014082
APN: 108-018.00
Disclaimer: Certain information contained herein is derived from information provided by parties other than Homes.com. All information provided is deemed reliable, but is not guaranteed to be accurate and should be independently verified.
![]() Based on information submitted to the MLS GRID. All data is obtained from various sources and may not have been verified by broker or MLS GRID. Supplied Open House Information is subject to change without notice. All information should be independently reviewed and verified for accuracy. Properties may or may not be listed by the office/agent presenting the information. Some IDX listings have been excluded from this website.
Based on information submitted to the MLS GRID. All data is obtained from various sources and may not have been verified by broker or MLS GRID. Supplied Open House Information is subject to change without notice. All information should be independently reviewed and verified for accuracy. Properties may or may not be listed by the office/agent presenting the information. Some IDX listings have been excluded from this website.
Based on information submitted to the MLS GRID
- 00 Harts Bridge Road and Lester Chapel Rd
- 367 Deep Gap Rd
- 184 Deep Gap Rd
- 58 Deep Gap Rd
- 45 Lesters Chapel Rd
- 475 Harts Bridge Rd
- 131 Old Pinson Rd
- 402 Harts Bridge Rd
- 124 Penny Ln
- 49 Dakota Cove
- 49 Brenda Ln
- 31 Renee Cove
- 21 Camellia Dr
- 0 Us-45 N
- 101 Wilde Rd
- 30 Dustin Cove
- 0 Meridian Springs Dr
- 37 Watlington Rd
- 222 Dustin Dr
- 107 Overton Dr
- 4 Susan Cove
- 11 Susan Cove Unit L
- 17 Tricia Cove Unit L
- 5 3rd St
- 8 4th St
- 416 E Lafayette St
- 100 Boardwalk Cove
- 390 N Liberty St
- 102 Jackson Walk Plaza
- 136 McCowat St Unit A
- 100 Parkwood Trace
- 226 McCowat St
- 412 Lambuth Blvd
- 321 Lambuth Blvd Unit A
- 119 Casey Rd
- 521 Lambuth Blvd Unit B
- 100 Park Ridge Dr
- 1056 Campbell St
- 2000 N Royal St
- 100 Chapel Ridge Dr

Ask me questions while you tour the home.