10477 Moorpark St Spring Valley, CA 91978
Estimated Value: $863,000 - $1,022,000
4
Beds
3
Baths
2,272
Sq Ft
$401/Sq Ft
Est. Value
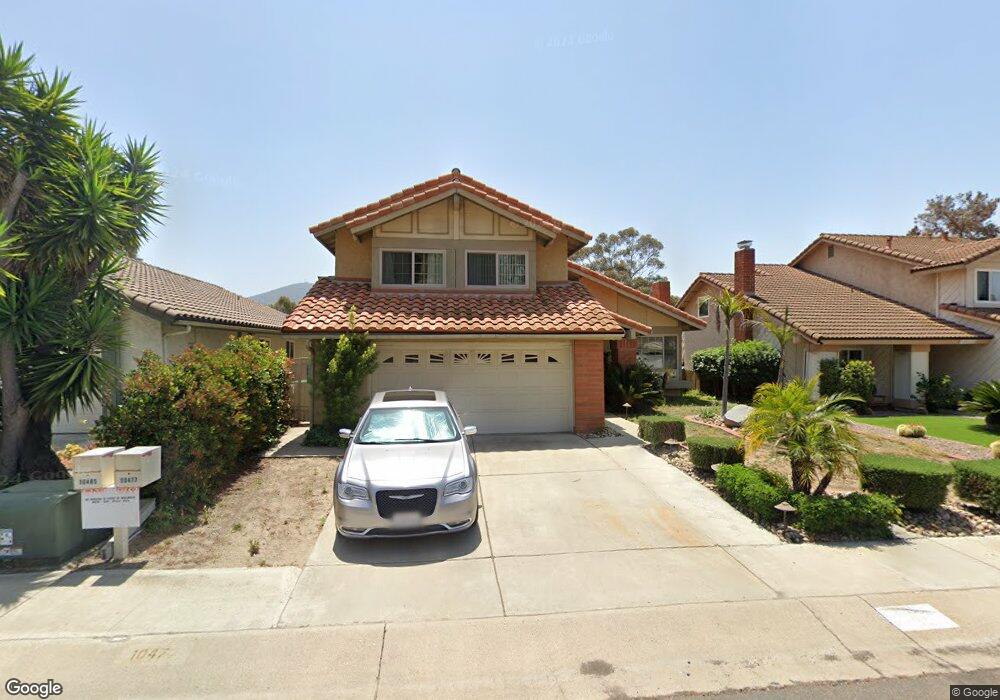
About This Home
This home is located at 10477 Moorpark St, Spring Valley, CA 91978 and is currently estimated at $911,199, approximately $401 per square foot. 10477 Moorpark St is a home located in San Diego County with nearby schools including Loma Elementary School, Spring Valley Middle School, and Monte Vista High School.
Ownership History
Date
Name
Owned For
Owner Type
Purchase Details
Closed on
May 20, 2013
Sold by
Johnson Vaughn F
Bought by
Johnson Halifu and Johnson Akili M
Current Estimated Value
Purchase Details
Closed on
Feb 25, 2002
Sold by
Johnson Carol
Bought by
Johnson Vaughn F
Home Financials for this Owner
Home Financials are based on the most recent Mortgage that was taken out on this home.
Original Mortgage
$240,000
Interest Rate
6.8%
Purchase Details
Closed on
Oct 13, 1995
Sold by
Johnson Vaughn F
Bought by
Johnson Vaughn F
Home Financials for this Owner
Home Financials are based on the most recent Mortgage that was taken out on this home.
Original Mortgage
$167,000
Interest Rate
7.58%
Purchase Details
Closed on
Aug 27, 1993
Sold by
Johnson Vaughn F and Johnson Dorothy J
Bought by
Johnson Vaughn F
Home Financials for this Owner
Home Financials are based on the most recent Mortgage that was taken out on this home.
Original Mortgage
$144,376
Interest Rate
9.95%
Create a Home Valuation Report for This Property
The Home Valuation Report is an in-depth analysis detailing your home's value as well as a comparison with similar homes in the area
Home Values in the Area
Average Home Value in this Area
Purchase History
| Date | Buyer | Sale Price | Title Company |
|---|---|---|---|
| Johnson Halifu | -- | None Available | |
| Johnson Vaughn F | -- | Commerce Title | |
| Johnson Vaughn F | -- | Fidelity National Title Ins | |
| Johnson Vaughn F | -- | Orange Coast Title Co |
Source: Public Records
Mortgage History
| Date | Status | Borrower | Loan Amount |
|---|---|---|---|
| Closed | Johnson Vaughn F | $240,000 | |
| Closed | Johnson Vaughn F | $167,000 | |
| Closed | Johnson Vaughn F | $144,376 |
Source: Public Records
Tax History Compared to Growth
Tax History
| Year | Tax Paid | Tax Assessment Tax Assessment Total Assessment is a certain percentage of the fair market value that is determined by local assessors to be the total taxable value of land and additions on the property. | Land | Improvement |
|---|---|---|---|---|
| 2025 | $4,951 | $369,412 | $135,449 | $233,963 |
| 2024 | $4,951 | $362,170 | $132,794 | $229,376 |
| 2023 | $4,796 | $355,070 | $130,191 | $224,879 |
| 2022 | $4,717 | $348,109 | $127,639 | $220,470 |
| 2021 | $4,671 | $341,285 | $125,137 | $216,148 |
| 2020 | $4,486 | $337,786 | $123,854 | $213,932 |
| 2019 | $4,420 | $331,164 | $121,426 | $209,738 |
| 2018 | $4,289 | $324,672 | $119,046 | $205,626 |
| 2017 | $4,189 | $318,307 | $116,712 | $201,595 |
| 2016 | $4,036 | $312,067 | $114,424 | $197,643 |
| 2015 | $4,004 | $307,381 | $112,706 | $194,675 |
| 2014 | $3,932 | $301,361 | $110,499 | $190,862 |
Source: Public Records
Map
Nearby Homes
- 10491 Moorpark St
- 10770 Jamacha Blvd Unit 78
- 3021 Chipwood Ct
- 2960 Elm Tree Ct
- 2914 Elm Tree Ct
- 3049 Golden Oak Way
- 3047 Blue Oak Ct
- 2976 Anawood Way
- 10707 Jamacha Blvd Unit Spc 191
- 10707 Jamacha Blvd Unit 241
- 10707 Jamacha Blvd Unit 161
- 10707 Jamacha Blvd Unit 235
- 10707 Jamacha Blvd Unit 24
- 10707 Jamacha Blvd Unit 72
- 10707 Jamacha Blvd Unit 30
- 10129 Hercules Way
- 2916 Alanwood Ct
- 2914 Alanwood Ct
- 2944 Alanwood Ct
- 10767 Jamacha Blvd
- 10471 Moorpark St
- 10485 Moorpark St
- 10467 Moorpark St
- 10478 Moorpark St
- 10486 Moorpark St
- 10457 Moorpark St
- 10492 Moorpark St
- 10462 Moorpark St
- 10447 Moorpark St
- 10498 Moorpark St
- 10452 Moorpark St
- 10461 Austin Dr
- 10438 Moorpark St
- 10435 Moorpark St
- 10503 Moorpark St
- 10504 Moorpark St
- 10430 Moorpark St
- 10429 Moorpark St
- 10509 Moorpark St
- 10510 Moorpark St