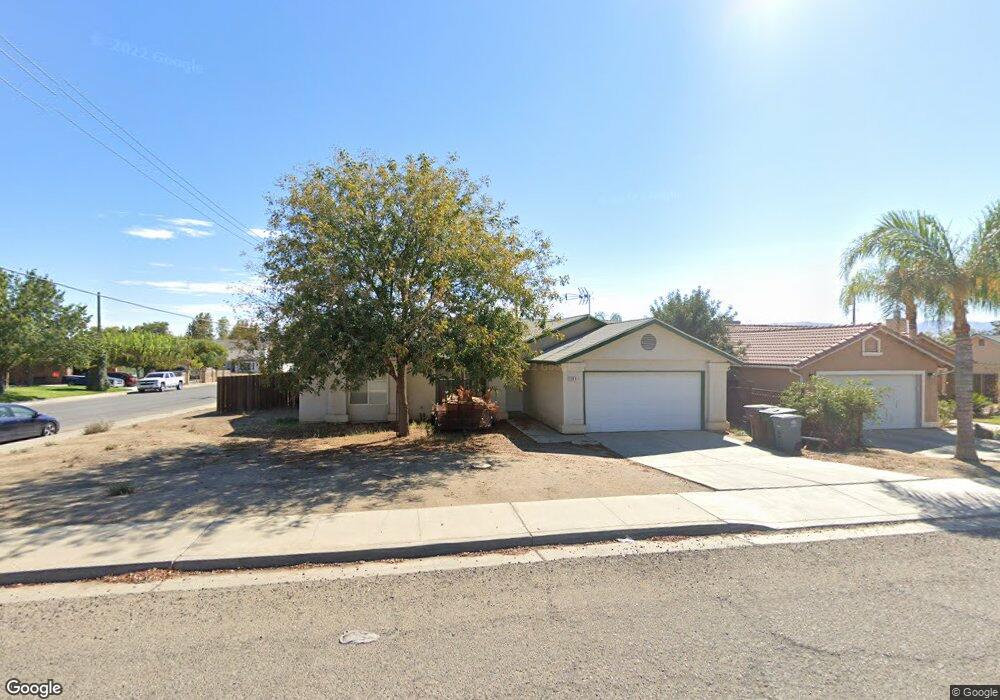
1048 E Yosemite St Avenal, CA 93204
Estimated Value: $252,000 - $339,000
4
Beds
2
Baths
1,418
Sq Ft
$204/Sq Ft
Est. Value
About This Home
This home is located at 1048 E Yosemite St, Avenal, CA 93204 and is currently estimated at $288,605, approximately $203 per square foot. 1048 E Yosemite St is a home located in Kings County with nearby schools including Tamarack Elementary School, Reef Sunset Middle School, and Avenal High School.
Ownership History
Date
Name
Owned For
Owner Type
Purchase Details
Closed on
May 18, 2021
Sold by
Decou John E and Decou Ladonna C
Bought by
Lipper Blane A
Current Estimated Value
Home Financials for this Owner
Home Financials are based on the most recent Mortgage that was taken out on this home.
Original Mortgage
$122,500
Interest Rate
2.9%
Mortgage Type
New Conventional
Purchase Details
Closed on
Jun 11, 2019
Sold by
Decou John E and Decou Ladonna C
Bought by
Decou John E and Decou Ladonna C
Purchase Details
Closed on
Oct 8, 2003
Sold by
Allied Quality Homes Inc
Bought by
Decou John and Decou Ladonna
Home Financials for this Owner
Home Financials are based on the most recent Mortgage that was taken out on this home.
Original Mortgage
$99,864
Interest Rate
5.72%
Mortgage Type
Purchase Money Mortgage
Create a Home Valuation Report for This Property
The Home Valuation Report is an in-depth analysis detailing your home's value as well as a comparison with similar homes in the area
Purchase History
| Date | Buyer | Sale Price | Title Company |
|---|---|---|---|
| Lipper Blane A | $175,000 | Chicago Title Company | |
| Decou John E | -- | None Available | |
| Decou John | $105,500 | First American Title Company |
Source: Public Records
Mortgage History
| Date | Status | Borrower | Loan Amount |
|---|---|---|---|
| Previous Owner | Lipper Blane A | $122,500 | |
| Previous Owner | Decou John | $99,864 |
Source: Public Records
Tax History
| Year | Tax Paid | Tax Assessment Tax Assessment Total Assessment is a certain percentage of the fair market value that is determined by local assessors to be the total taxable value of land and additions on the property. | Land | Improvement |
|---|---|---|---|---|
| 2025 | $1,938 | $185,710 | $58,366 | $127,344 |
| 2023 | $1,938 | $178,500 | $56,100 | $122,400 |
| 2022 | $2,082 | $175,000 | $55,000 | $120,000 |
| 2021 | $1,570 | $138,075 | $13,134 | $124,941 |
| 2020 | $1,523 | $136,659 | $12,999 | $123,660 |
| 2019 | $1,509 | $133,979 | $12,744 | $121,235 |
| 2018 | $1,516 | $131,352 | $12,494 | $118,858 |
| 2017 | $1,448 | $128,776 | $12,249 | $116,527 |
| 2016 | $1,410 | $126,251 | $12,009 | $114,242 |
| 2015 | $1,441 | $124,355 | $11,829 | $112,526 |
| 2014 | $1,383 | $121,919 | $11,597 | $110,322 |
Source: Public Records
Map
Nearby Homes
- 1044 E Yosemite St
- 305 S Corcoran Ave
- 1049 E Lassen St
- 1040 E Yosemite St
- 309 S Corcoran Ave
- 1045 E Lassen St
- 301 S Corcoran Ave
- 313 S Corcoran Ave
- 1041 E Lassen St
- 1036 E Yosemite St
- 217 S Corcoran Ave
- 317 S Corcoran Ave
- 304 Armona Ave
- 208 S Corcoran Ave
- 940 E Lassen St
- 1037 E Lassen St
- 1037 E Lassen St
- 213 S Corcoran Ave
- 300 Armona Ave
- 1032 E Yosemite St
Your Personal Tour Guide
Ask me questions while you tour the home.