NOT LISTED FOR SALE

1048 Inverrary Ln Unit 1048 Deerfield, IL 60015

Estimated Value: $237,484 - $260,000

2 Beds
1 Bath
900 Sq Ft
$277/Sq Ft Est. Value

Last Sold May 18, 2018

Last sale price $165,000 $183 Per Sq Ft

Est. 51% increase in value since last sale

Current estimated payment $1,877/month

About This Home

As of May 2018

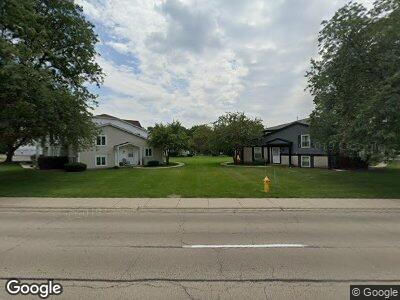
Beautiful ready move in condition townhouse, great interior location,stainless steel appliances, washer and dryer in unit, lots of storage space. Stevenson high school district. Walk to pools and park, close to tollway,train station and shopping. Won't last at this price!

Ownership History

Date Name Owned For Owner Type

Purchase Details

Listed on
Jun 27, 2018
Closed on
May 18, 2018
Sold by
Novak Eugene J
Bought by
Jose Reuel Neil
Seller's Agent
Gina Back
HomeSmart Connect LLC
Buyer's Agent
Gina Back
HomeSmart Connect LLC
Sold Price
$1,500
Current Estimated Value
$249,621

Home Financials for this Owner

Home Financials are based on the most recent Mortgage that was taken out on this home.
Estimated Appreciation
$248,121
Avg. Annual Appreciation
6.07%
Original Mortgage
$156,750
Outstanding Balance
$136,766
Interest Rate
4.62%
Mortgage Type
New Conventional
Estimated Equity
$112,855

Range of Values:

Collateral Analytics

Collateral Analytics Collateral Analytics AVMs (Automated Valuation Model) employ a number of statistical approaches combined with neighborhood-specific comparable selection guarantees the most up-to-date and precise valuations.

Not Available

Collateral Analytics does not have data for the current month. Please view the chart for historical values.

ICE

ICE Mortgage Technology ICE Mortgage Technology’s AVM (Automated Valuation Model) is a state-of-the-art online residential property valuation tool that provides a quick and accurate estimate of the value of almost any home in the U.S.

Not Available

ICE Mortgage Technology does not have data for the current month. Please view the chart for historical values.

First American

First American First American Data & Analytics’ next-generation AVM combines unrivaled data assets with a blended ensemble of valuation models to produce highly accurate, reliable valuations you can trust.

Not Available

First American does not have data for the current month. Please view the chart for historical values.

Quantarium

Quantarium Quantarium’s valuation service, repeatedly proven the industry’s most accurate and comprehensive, is supercharged with a self-learning and auto-tuning AI engine that continually becomes smarter and more accurate as it processes daily inputs from the industry’s leading RE data lake.

Not Available

Quantarium does not have data for the current month. Please view the chart for historical values.

Average Value
Not Available
List Price
Sold Price
Create a Home Valuation Report for This Property
The Home Valuation Report is an in-depth analysis detailing your home's value as well as a comparison with similar homes in the area

Home Values in the Area

Source: Public Records

Average Home Value in this Area


Source: Public Records

Purchase History

Date Buyer Sale Price Title Company
Jose Reuel Neil $165,000 Burnet Title Post Closing
Source: Public Records

Mortgage History

Date Status Borrower Loan Amount
Open Jose Reuel Neil $156,750
Previous Owner Novak Eugene J $50,000
Source: Public Records

Property History

Date Event Price Change Sq Ft Price
07/02/2018 07/02/18 Rented $1,500 0.0% --
06/27/2018 06/27/18 For Rent $1,500 0.0% --
05/18/2018 05/18/18 Sold $165,000 +1.5% $183 / Sq Ft
03/31/2018 03/31/18 Pending -- -- --
03/28/2018 03/28/18 For Sale $162,500 -- $181 / Sq Ft

Tax History Compared to Growth

Source: Public Records

Tax History

Year Tax Paid Tax Assessment Tax Assessment Total Assessment is a certain percentage of the fair market value that is determined by local assessors to be the total taxable value of land and additions on the property. Land Improvement
2024 $5,756 $66,696 $29,512 $37,184
2023 $4,737 $58,816 $26,025 $32,791
2022 $4,737 $51,393 $22,740 $28,653
2021 $4,552 $50,839 $22,495 $28,344
2020 $3,926 $51,013 $22,572 $28,441
2019 $3,809 $50,825 $22,489 $28,336
2018 $3,087 $42,432 $24,447 $17,985
2017 $3,041 $41,441 $23,876 $17,565
2016 $2,913 $39,683 $22,863 $16,820
2015 $2,834 $37,111 $21,381 $15,730
2014 $2,986 $38,549 $22,963 $15,586
2012 $2,939 $38,626 $23,009 $15,617
Source: Public Records

Agents Affiliated with this Home

  • Section Image
  • Section Image
See All Agents

Map