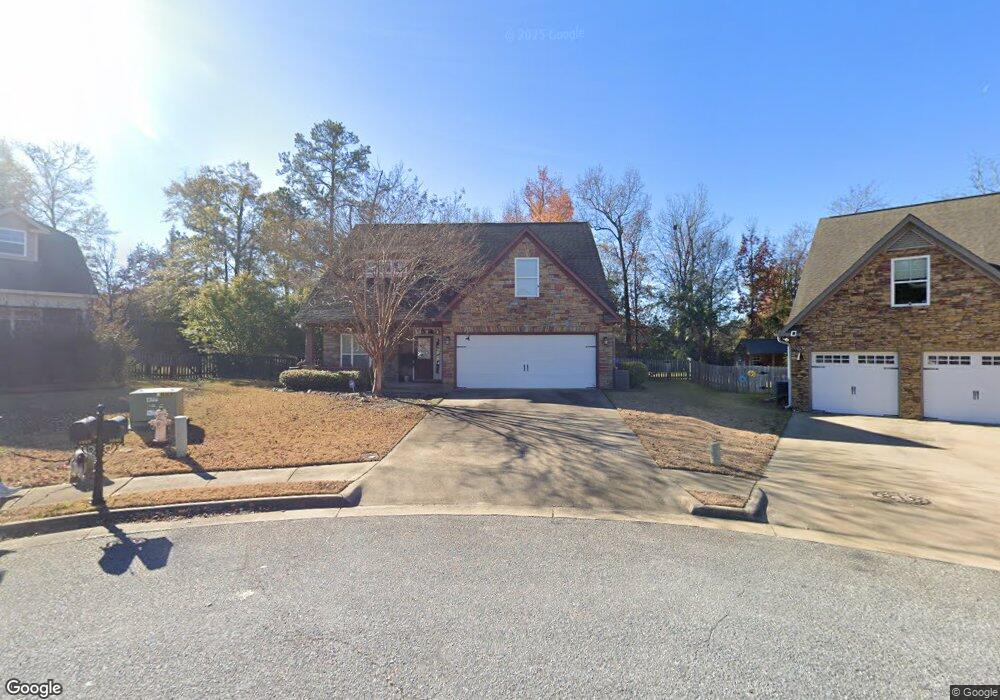
1048 Red Maple Way Columbus, GA 31904
Northern Columbus NeighborhoodEstimated Value: $376,000 - $406,000
5
Beds
3
Baths
2,673
Sq Ft
$145/Sq Ft
Est. Value
About This Home
This home is located at 1048 Red Maple Way, Columbus, GA 31904 and is currently estimated at $388,050, approximately $145 per square foot. 1048 Red Maple Way is a home located in Muscogee County with nearby schools including Double Churches Elementary School, Double Churches Middle School, and Northside High School.
Ownership History
Date
Name
Owned For
Owner Type
Purchase Details
Closed on
Nov 29, 2019
Sold by
Heninger Jennifer
Bought by
Biddy William and Rossa Natalia Angelim
Current Estimated Value
Purchase Details
Closed on
Aug 31, 2011
Sold by
Heninger Steve
Bought by
Heninger Jennifer
Purchase Details
Closed on
Mar 22, 2007
Sold by
Bill Hart Inc
Bought by
Heninger Steve A and Heninger Jennifer Kay Cuevas
Home Financials for this Owner
Home Financials are based on the most recent Mortgage that was taken out on this home.
Original Mortgage
$297,250
Interest Rate
6.18%
Mortgage Type
VA
Create a Home Valuation Report for This Property
The Home Valuation Report is an in-depth analysis detailing your home's value as well as a comparison with similar homes in the area
Home Values in the Area
Average Home Value in this Area
Purchase History
| Date | Buyer | Sale Price | Title Company |
|---|---|---|---|
| Biddy William | $260,000 | -- | |
| Heninger Jennifer | -- | -- | |
| Heninger Steve A | $297,300 | None Available | |
| Columbus Bank & Trust Co | -- | None Available |
Source: Public Records
Mortgage History
| Date | Status | Borrower | Loan Amount |
|---|---|---|---|
| Previous Owner | Heninger Steve A | $297,250 |
Source: Public Records
Tax History Compared to Growth
Tax History
| Year | Tax Paid | Tax Assessment Tax Assessment Total Assessment is a certain percentage of the fair market value that is determined by local assessors to be the total taxable value of land and additions on the property. | Land | Improvement |
|---|---|---|---|---|
| 2025 | $3,508 | $140,008 | $17,812 | $122,196 |
| 2024 | $351 | $140,008 | $17,812 | $122,196 |
| 2023 | $2,835 | $140,008 | $17,812 | $122,196 |
| 2022 | $3,657 | $105,724 | $17,812 | $87,912 |
| 2021 | $3,658 | $102,796 | $17,812 | $84,984 |
| 2020 | $4,198 | $102,796 | $17,812 | $84,984 |
| 2019 | $4,212 | $102,796 | $17,812 | $84,984 |
| 2018 | $4,212 | $102,796 | $17,812 | $84,984 |
| 2017 | $4,225 | $102,796 | $17,812 | $84,984 |
| 2016 | $4,628 | $112,200 | $23,200 | $89,000 |
| 2015 | $4,173 | $118,857 | $23,200 | $95,657 |
| 2014 | $4,367 | $118,857 | $23,200 | $95,657 |
| 2013 | -- | $118,857 | $23,200 | $95,657 |
Source: Public Records
Map
Nearby Homes
- 1049 Red Maple Way
- 1255 Woodville Ct
- 1355 Cloverdale Rd
- 907 Double Churches Rd
- 7348 Cedar Creek Loop
- 6969 Mobley Rd
- 7131 Whitesville Rd
- 7701 Gray Shoals Dr
- 7635 Edgewater Dr
- 7020 Redwood Dr
- 6836 Sharmel Ln
- 1438 Grove Park Dr Unit 8B
- 1438 Grove Park Dr Unit 13B
- 7185 Helen Dr
- 7995 Big Creek Place
- 6825 Ellis Dr
- 1058 Cedarbrook Dr
- 7841 Edgewater Dr
- 1719 Double Churches Rd
- 7233 Mobley Walk Dr
- 1046 Red Maple Way
- 1243 Woodville Ct
- 1239 Woodville Ct
- 1235 Woodville Ct
- 1044 Red Maple Way
- 1247 Woodville Ct
- 1047 Red Maple Way
- 1042 Red Maple Way
- 1231 Woodville Ct
- 1251 Woodville Ct
- 1045 Red Maple Way
- 1040 Red Maple Way
- 1043 Red Maple Way
- 1227 Woodville Ct
- 7221 Woodham Ct
- 1041 Red Maple Way
- 1038 Red Maple Way
- 1240 Woodville Ct
- 1259 Woodville Ct
- 7218 Woodham Ct