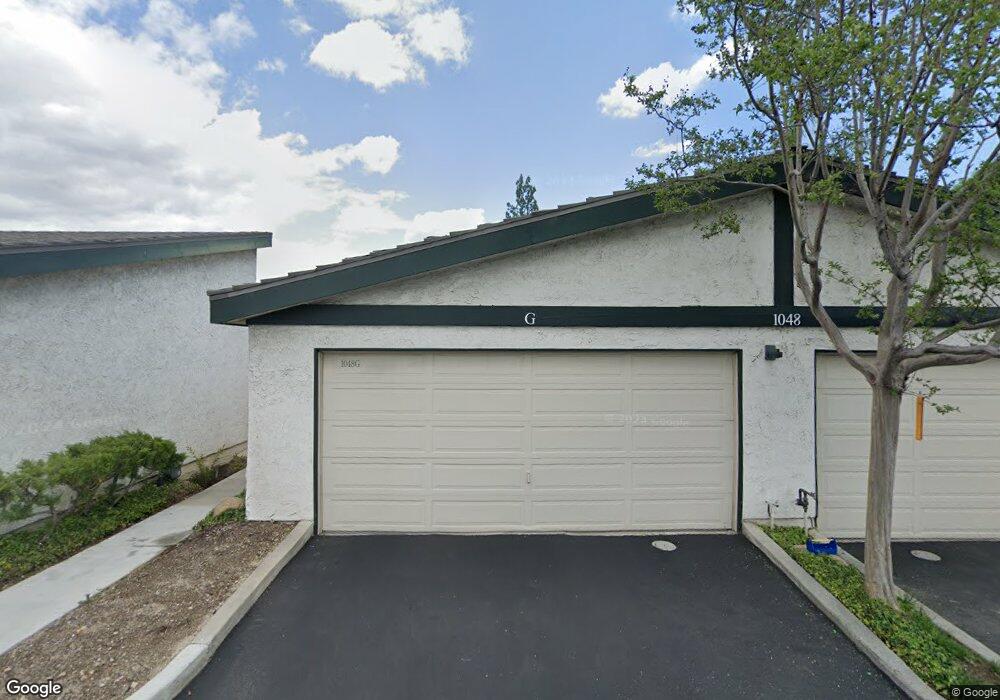
1048 Royal Oaks Dr Unit E Monrovia, CA 91016
Estimated Value: $686,000 - $744,000
3
Beds
2
Baths
1,140
Sq Ft
$626/Sq Ft
Est. Value
About This Home
This home is located at 1048 Royal Oaks Dr Unit E, Monrovia, CA 91016 and is currently estimated at $713,263, approximately $625 per square foot. 1048 Royal Oaks Dr Unit E is a home located in Los Angeles County with nearby schools including Bradoaks Elementary Science Academy, Clifton Middle School, and Monrovia High School.
Ownership History
Date
Name
Owned For
Owner Type
Purchase Details
Closed on
Feb 7, 2017
Sold by
Barkiey Joseph K
Bought by
Hudson Kristy Lee
Current Estimated Value
Purchase Details
Closed on
May 16, 2005
Sold by
Carter Ian Martin
Bought by
Barkley Joseph K and Barkley Katherine L
Home Financials for this Owner
Home Financials are based on the most recent Mortgage that was taken out on this home.
Original Mortgage
$332,000
Interest Rate
1.25%
Mortgage Type
Negative Amortization
Purchase Details
Closed on
Nov 26, 2001
Sold by
Wagner Pamela Lynn
Bought by
Carter Ian Martin
Home Financials for this Owner
Home Financials are based on the most recent Mortgage that was taken out on this home.
Original Mortgage
$192,971
Interest Rate
6.63%
Mortgage Type
FHA
Purchase Details
Closed on
Dec 29, 2000
Sold by
Wagner Susan
Bought by
Wagner Susan and Susan Wagner Trust
Create a Home Valuation Report for This Property
The Home Valuation Report is an in-depth analysis detailing your home's value as well as a comparison with similar homes in the area
Home Values in the Area
Average Home Value in this Area
Purchase History
| Date | Buyer | Sale Price | Title Company |
|---|---|---|---|
| Hudson Kristy Lee | $455,000 | North American Title | |
| Barkley Joseph K | $415,000 | First American Title Company | |
| Carter Ian Martin | $196,000 | Commonwealth Land Title | |
| Wagner Susan | -- | -- |
Source: Public Records
Mortgage History
| Date | Status | Borrower | Loan Amount |
|---|---|---|---|
| Previous Owner | Barkley Joseph K | $332,000 | |
| Previous Owner | Carter Ian Martin | $192,971 |
Source: Public Records
Tax History
| Year | Tax Paid | Tax Assessment Tax Assessment Total Assessment is a certain percentage of the fair market value that is determined by local assessors to be the total taxable value of land and additions on the property. | Land | Improvement |
|---|---|---|---|---|
| 2025 | $7,135 | $528,058 | $422,102 | $105,956 |
| 2024 | $7,135 | $517,705 | $413,826 | $103,879 |
| 2023 | $6,972 | $507,555 | $405,712 | $101,843 |
| 2022 | $6,770 | $497,604 | $397,757 | $99,847 |
| 2021 | $6,638 | $487,848 | $389,958 | $97,890 |
| 2019 | $6,323 | $473,381 | $378,393 | $94,988 |
| 2018 | $6,168 | $464,100 | $370,974 | $93,126 |
| 2016 | $5,633 | $422,000 | $337,600 | $84,400 |
| 2015 | $5,540 | $418,000 | $334,400 | $83,600 |
| 2014 | $5,288 | $394,000 | $315,200 | $78,800 |
Source: Public Records
Map
Nearby Homes
- 1120 Sesmas St
- 1020 S Mountain Ave Unit 24
- 938 Huntington Dr Unit K
- 603 Park Rose Ave
- 1367 3rd St
- 820 Junipero Dr
- 925 Cabrillo Dr Unit C
- 165 Circle Dr
- 526 E Olive Ave Unit A
- 1640 Cinco Robles Dr
- 188 Deodar Ln
- 108 S Mountain Ave Unit A
- 418 E Olive Ave
- 1406 S California Ave Unit D
- 201 Deodar Ln
- 401 E Cherry Ave
- 520 E Lime Ave
- 1861 Broadland Ave
- 835 E Foothill Blvd
- 61 Palm Hill Ln
- 1048 Royal Oaks Dr Unit K
- 1048 Royal Oaks Dr Unit J
- 1048 Royal Oaks Dr Unit H
- 1048 Royal Oaks Dr Unit G
- 1048 Royal Oaks Dr Unit F
- 1048 Royal Oaks Dr Unit D
- 1048 Royal Oaks Dr Unit C
- 1048 Royal Oaks Dr Unit B
- 1048 Royal Oaks Dr Unit A
- 1046 Royal Oaks Dr Unit D
- 1046 Royal Oaks Dr Unit E
- 1046 Royal Oaks Dr Unit A
- 1046 Royal Oaks Dr Unit C
- 1034 Royal Oaks Dr Unit K
- 1034 Royal Oaks Dr Unit J
- 1034 Royal Oaks Dr Unit H
- 1034 Royal Oaks Dr Unit G
- 1034 Royal Oaks Dr Unit F
- 1034 Royal Oaks Dr Unit E
- 1034 Royal Oaks Dr Unit D
Your Personal Tour Guide
Ask me questions while you tour the home.