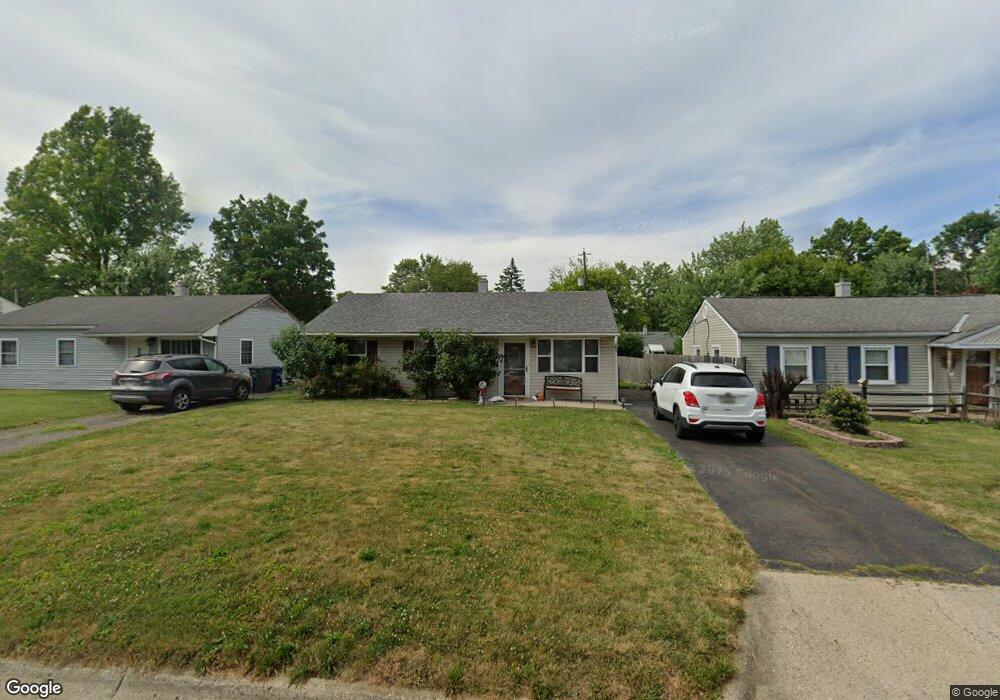
1048 Strimple Ave Columbus, OH 43229
Salem Village NeighborhoodEstimated Value: $204,072 - $252,000
3
Beds
1
Bath
925
Sq Ft
$243/Sq Ft
Est. Value
About This Home
This home is located at 1048 Strimple Ave, Columbus, OH 43229 and is currently estimated at $224,518, approximately $242 per square foot. 1048 Strimple Ave is a home located in Franklin County with nearby schools including Salem Elementary School, Dominion Middle School, and Whetstone High School.
Ownership History
Date
Name
Owned For
Owner Type
Purchase Details
Closed on
Nov 9, 2007
Sold by
South Christopher C and South Mindy
Bought by
Garcia Dhalma
Current Estimated Value
Home Financials for this Owner
Home Financials are based on the most recent Mortgage that was taken out on this home.
Original Mortgage
$100,000
Outstanding Balance
$63,564
Interest Rate
6.47%
Mortgage Type
Purchase Money Mortgage
Estimated Equity
$160,954
Purchase Details
Closed on
Jun 3, 2007
Sold by
Fonseca Esteban and Fonseca Cheryl L
Bought by
South Christopher C
Home Financials for this Owner
Home Financials are based on the most recent Mortgage that was taken out on this home.
Original Mortgage
$83,800
Interest Rate
5%
Mortgage Type
Commercial
Purchase Details
Closed on
Jul 23, 1999
Sold by
Home Investors Inc
Bought by
Fonseca Esteban and Fonseca Cheryl L
Purchase Details
Closed on
Jun 21, 1999
Sold by
Lutz Steven W and Chase Mtg Services Inc
Bought by
Home Investors Inc
Purchase Details
Closed on
Sep 27, 1978
Bought by
Lutz Steven W
Create a Home Valuation Report for This Property
The Home Valuation Report is an in-depth analysis detailing your home's value as well as a comparison with similar homes in the area
Home Values in the Area
Average Home Value in this Area
Purchase History
| Date | Buyer | Sale Price | Title Company |
|---|---|---|---|
| Garcia Dhalma | $100,000 | Attorney | |
| South Christopher C | $62,500 | Pillar | |
| Fonseca Esteban | $69,900 | -- | |
| Home Investors Inc | $51,000 | -- | |
| Lutz Steven W | $29,900 | -- |
Source: Public Records
Mortgage History
| Date | Status | Borrower | Loan Amount |
|---|---|---|---|
| Open | Garcia Dhalma | $100,000 | |
| Previous Owner | South Christopher C | $83,800 |
Source: Public Records
Tax History Compared to Growth
Tax History
| Year | Tax Paid | Tax Assessment Tax Assessment Total Assessment is a certain percentage of the fair market value that is determined by local assessors to be the total taxable value of land and additions on the property. | Land | Improvement |
|---|---|---|---|---|
| 2024 | $2,498 | $55,650 | $18,760 | $36,890 |
| 2023 | $2,466 | $55,650 | $18,760 | $36,890 |
| 2022 | $1,775 | $34,230 | $11,130 | $23,100 |
| 2021 | $1,778 | $34,230 | $11,130 | $23,100 |
| 2020 | $1,781 | $34,230 | $11,130 | $23,100 |
| 2019 | $1,629 | $26,850 | $8,580 | $18,270 |
| 2018 | $1,472 | $26,850 | $8,580 | $18,270 |
| 2017 | $1,540 | $26,850 | $8,580 | $18,270 |
| 2016 | $1,452 | $21,920 | $7,810 | $14,110 |
| 2015 | $1,318 | $21,920 | $7,810 | $14,110 |
| 2014 | $1,321 | $21,920 | $7,810 | $14,110 |
| 2013 | $686 | $23,065 | $8,225 | $14,840 |
Source: Public Records
Map
Nearby Homes
- 964 Strimple Ave
- 5318 Eisenhower Rd
- 5415 Vinewood Ct
- 5462 Roche Dr
- 4983 Almont Dr
- 5480 Rockwood Ct Unit R1
- 5475 Worthington Forest Pl E Unit 5475
- 734 Worthington Forest Place Unit 734
- 5548 Roche Dr
- 5579 Norcross Rd
- 4904 Almont Dr
- 1116 Tulsa Dr
- 1385 Thurell Rd
- 627 S Selby Blvd
- 4840 Almont Dr
- 582 E Lincoln Ave
- 569 Chase Rd
- 1469 Sandalwood Place
- 1414 Alvina Dr
- 5674 Lindenwood Rd
- 1042 Strimple Ave
- 1054 Strimple Ave
- 1036 Strimple Ave
- 1062 Strimple Ave
- 1047 Minerva Ave
- 1053 Minerva Ave
- 1041 Minerva Ave
- 1061 Minerva Ave
- 1068 Strimple Ave
- 1028 Strimple Ave
- 1035 Minerva Ave
- 1055 Strimple Ave
- 1067 Minerva Ave
- 1047 Strimple Ave
- 1061 Strimple Ave
- 1074 Strimple Ave
- 1022 Strimple Ave
- 1041 Strimple Ave
- 1069 Strimple Ave
- 1075 Minerva Ave