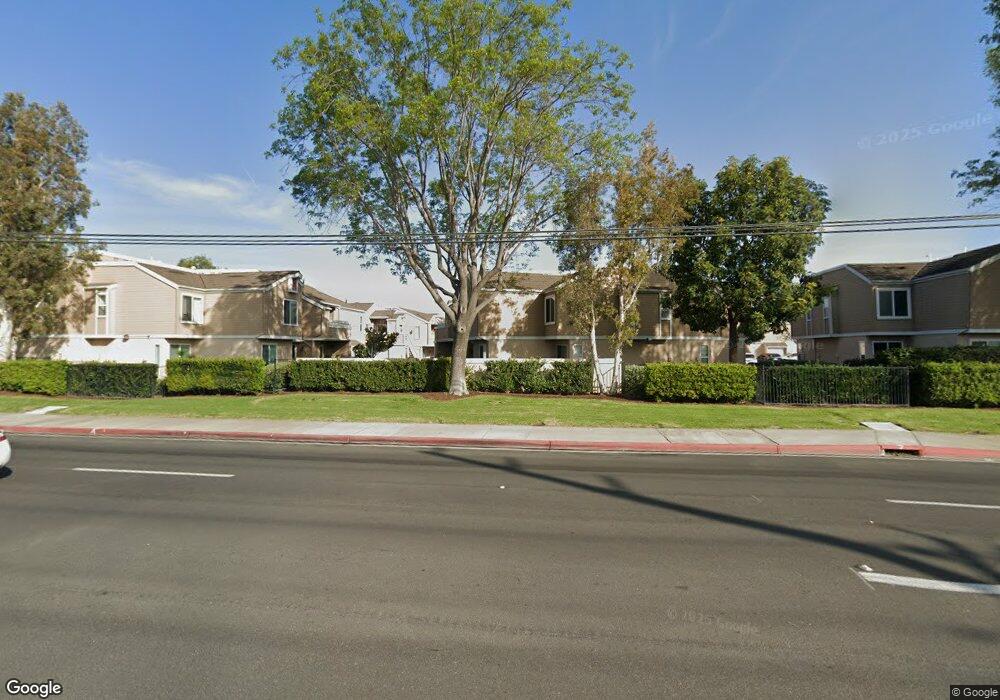
10487 W Briar Oaks Dr Unit 191 Stanton, CA 90680
West Anaheim NeighborhoodEstimated Value: $569,390 - $602,000
2
Beds
2
Baths
1,027
Sq Ft
$568/Sq Ft
Est. Value
About This Home
This home is located at 10487 W Briar Oaks Dr Unit 191, Stanton, CA 90680 and is currently estimated at $582,848, approximately $567 per square foot. 10487 W Briar Oaks Dr Unit 191 is a home located in Orange County with nearby schools including Hansen Elementary School, Orangeview Junior High, and Western High School.
Ownership History
Date
Name
Owned For
Owner Type
Purchase Details
Closed on
Oct 8, 2012
Sold by
Park Barnabas C and Park Jennifer E
Bought by
Park Barnabas C and Park Jennifer E
Current Estimated Value
Home Financials for this Owner
Home Financials are based on the most recent Mortgage that was taken out on this home.
Original Mortgage
$166,457
Outstanding Balance
$28,783
Interest Rate
3.58%
Mortgage Type
New Conventional
Estimated Equity
$554,065
Purchase Details
Closed on
Jun 12, 2003
Sold by
Murphy Patrick and Murphy Sherrie
Bought by
Park Barnabus C and Park Jennifer E
Home Financials for this Owner
Home Financials are based on the most recent Mortgage that was taken out on this home.
Original Mortgage
$192,000
Interest Rate
5.18%
Mortgage Type
Purchase Money Mortgage
Create a Home Valuation Report for This Property
The Home Valuation Report is an in-depth analysis detailing your home's value as well as a comparison with similar homes in the area
Home Values in the Area
Average Home Value in this Area
Purchase History
| Date | Buyer | Sale Price | Title Company |
|---|---|---|---|
| Park Barnabas C | -- | Equity Title Orange County-I | |
| Park Barnabus C | $240,000 | Southland Title Corporation |
Source: Public Records
Mortgage History
| Date | Status | Borrower | Loan Amount |
|---|---|---|---|
| Open | Park Barnabas C | $166,457 | |
| Closed | Park Barnabus C | $192,000 |
Source: Public Records
Tax History Compared to Growth
Tax History
| Year | Tax Paid | Tax Assessment Tax Assessment Total Assessment is a certain percentage of the fair market value that is determined by local assessors to be the total taxable value of land and additions on the property. | Land | Improvement |
|---|---|---|---|---|
| 2025 | $4,134 | $341,218 | $229,739 | $111,479 |
| 2024 | $4,134 | $334,528 | $225,234 | $109,294 |
| 2023 | $4,029 | $327,969 | $220,818 | $107,151 |
| 2022 | $3,949 | $321,539 | $216,489 | $105,050 |
| 2021 | $3,983 | $315,235 | $212,244 | $102,991 |
| 2020 | $3,927 | $312,003 | $210,068 | $101,935 |
| 2019 | $3,822 | $305,886 | $205,949 | $99,937 |
| 2018 | $3,767 | $299,889 | $201,911 | $97,978 |
| 2017 | $3,639 | $294,009 | $197,952 | $96,057 |
| 2016 | $3,623 | $288,245 | $194,071 | $94,174 |
| 2015 | $3,579 | $283,916 | $191,156 | $92,760 |
| 2014 | $3,389 | $277,000 | $187,412 | $89,588 |
Source: Public Records
Map
Nearby Homes
- 10393 E Briar Oaks Dr Unit D
- 10552 Royal Oak Way
- 7652 Cerritos Ave
- 10626 Braeswood Way
- 7850 2nd St
- 10420 Vassar Way
- 10550 Western Ave
- 10550 Western Ave Unit 43
- 10550 Western Ave Unit 56
- 10550 Western Ave Unit 85
- 10550 Western Ave Unit 98
- 10531 Western Ave
- 10786 Mitchell Dr
- 3050 W Ball Rd Unit 171
- 3050 W Ball Rd Unit 115B
- 3050 W Ball Rd Unit 127
- 3050 W Ball Rd Unit 132
- 3050 W Ball Rd Unit 82
- 3050 W Ball Rd Unit 200
- 3050 W Ball Rd Unit 152
- 10485 W Briar Oaks Dr Unit C
- 10485 W Briar Oaks Dr Unit 188
- 10485 W Briar Oaks Dr Unit E
- 10485 W Briar Oaks Dr Unit A
- 10485 W Briar Oaks Dr Unit 189
- 10485 W Briar Oaks Dr Unit 186
- 10485 W Briar Oaks Dr Unit D
- 10487 W Briar Oaks Dr
- 10487 W Briar Oaks Dr Unit E
- 10487 W Briar Oaks Dr Unit 193
- 10487 W Briar Oaks Dr Unit 194
- 10487 W Briar Oaks Dr Unit 192
- 10487 W Briar Oaks Dr Unit 195
- 10495 W Briar Oaks Dr Unit D
- 10495 W Briar Oaks Dr
- 10495 W Briar Oaks Dr Unit 196
- 10495 W Briar Oaks Dr Unit B
- 10495 W Briar Oaks Dr Unit E
- 10495 W Briar Oaks Dr Unit 197
- 10495 W Briar Oaks Dr Unit 199