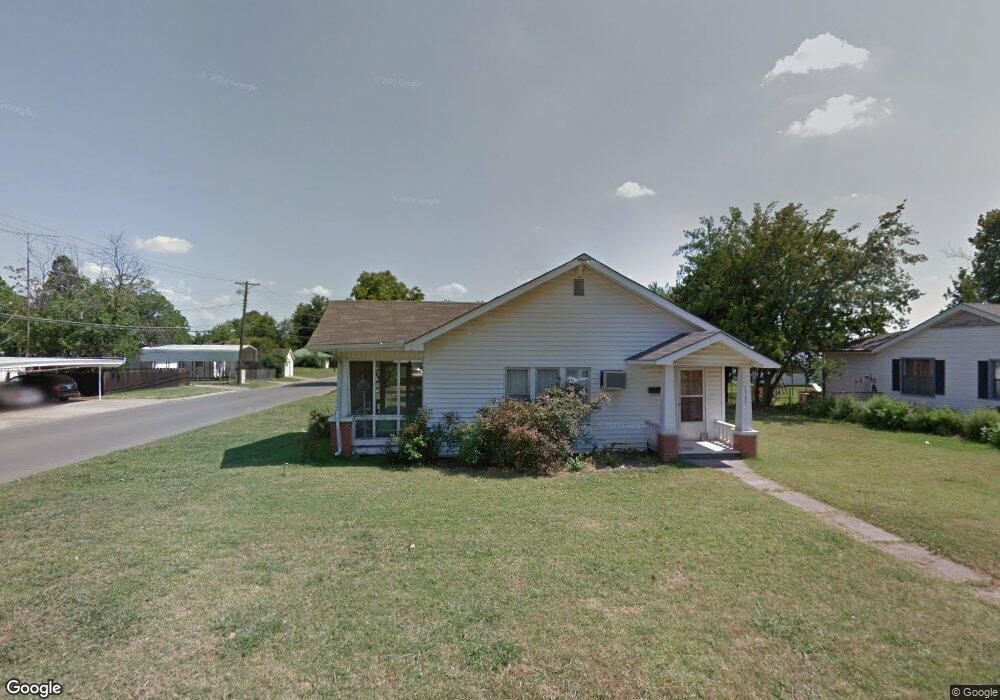
1049 E 4th St Cushing, OK 74023
Estimated Value: $115,000 - $129,572
3
Beds
2
Baths
1,380
Sq Ft
$86/Sq Ft
Est. Value
About This Home
This home is located at 1049 E 4th St, Cushing, OK 74023 and is currently estimated at $118,893, approximately $86 per square foot. 1049 E 4th St is a home located in Payne County with nearby schools including Cushing Upper Elementary School, Cushing Lower Elementary School, and Cushing High School.
Ownership History
Date
Name
Owned For
Owner Type
Purchase Details
Closed on
Apr 30, 2015
Sold by
Blankenship John T
Bought by
Manatowa Arian
Current Estimated Value
Home Financials for this Owner
Home Financials are based on the most recent Mortgage that was taken out on this home.
Original Mortgage
$37,525
Outstanding Balance
$28,709
Interest Rate
3.73%
Mortgage Type
New Conventional
Estimated Equity
$90,184
Purchase Details
Closed on
Nov 3, 2014
Sold by
Soby Billie Colleen
Bought by
Soby Edward
Purchase Details
Closed on
Sep 9, 2014
Sold by
Manatown Joel Lynn
Bought by
Soby Edward
Purchase Details
Closed on
Dec 19, 2012
Sold by
Manatowa Wanda S
Bought by
Manatowa Joel Lynn
Create a Home Valuation Report for This Property
The Home Valuation Report is an in-depth analysis detailing your home's value as well as a comparison with similar homes in the area
Purchase History
| Date | Buyer | Sale Price | Title Company |
|---|---|---|---|
| Manatowa Arian | -- | None Available | |
| Manatowa Arian | $26,000 | None Available | |
| Soby Edward | -- | None Available | |
| Soby Edward | -- | None Available | |
| Manatowa Joel Lynn | -- | None Available |
Source: Public Records
Mortgage History
| Date | Status | Borrower | Loan Amount |
|---|---|---|---|
| Open | Manatowa Arian | $37,525 | |
| Closed | Manatowa Arian | $37,525 |
Source: Public Records
Tax History
| Year | Tax Paid | Tax Assessment Tax Assessment Total Assessment is a certain percentage of the fair market value that is determined by local assessors to be the total taxable value of land and additions on the property. | Land | Improvement |
|---|---|---|---|---|
| 2025 | $551 | $5,914 | $523 | $5,391 |
| 2024 | $501 | $5,914 | $523 | $5,391 |
| 2023 | $501 | $5,632 | $531 | $5,101 |
| 2022 | $457 | $5,364 | $597 | $4,767 |
| 2021 | $424 | $5,109 | $640 | $4,469 |
| 2020 | $398 | $4,865 | $572 | $4,293 |
| 2019 | $396 | $4,635 | $958 | $3,677 |
| 2018 | $384 | $4,635 | $958 | $3,677 |
| 2017 | $381 | $4,634 | $958 | $3,676 |
| 2016 | $392 | $4,635 | $958 | $3,677 |
| 2015 | $450 | $5,198 | $585 | $4,613 |
| 2014 | $427 | $4,950 | $558 | $4,392 |
Source: Public Records
Map
Nearby Homes
- 1003 E 4th St
- 919 E 2nd St
- 843 E 4th St
- 112 S Highland Ave
- 1002 E Cherry St
- 1107 E 8th St
- 1217 E Cherry St
- 822 E 6th St
- 835 S Thompson Place
- 1224 E Cherry St
- 508 S Michigan Ave
- 904 W 9th St
- 1007 S Wilson Ave
- 9220 E 9th St
- 915 E Oak St
- 1217 E 9th St
- 732 E Broadway St
- 1301 E Ash St
- 811 Parkview Dr
- 1018 E 12th St
Your Personal Tour Guide
Ask me questions while you tour the home.