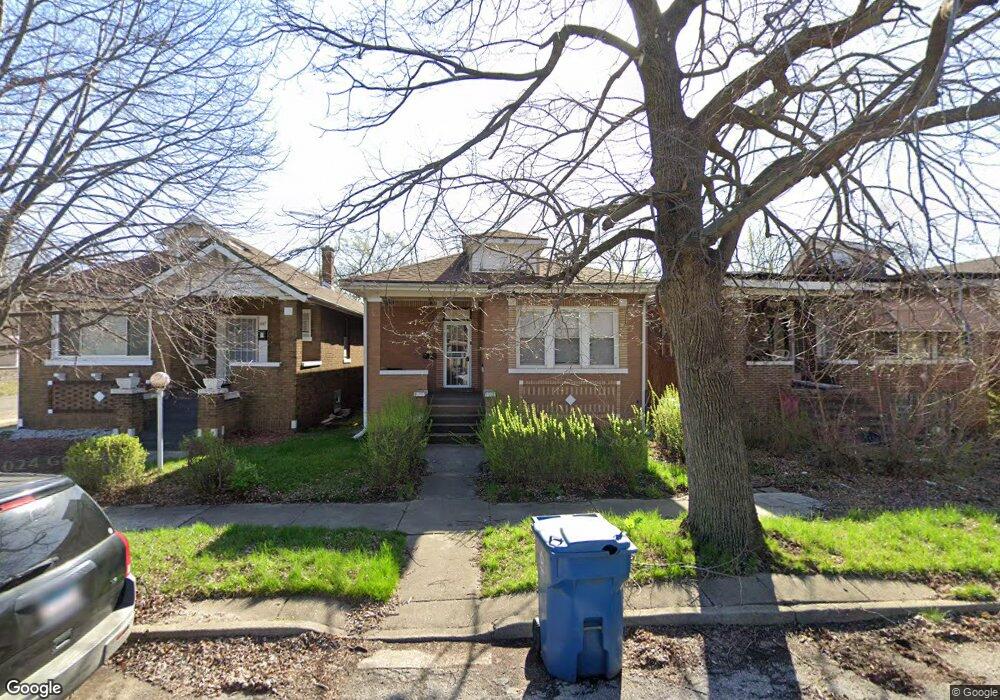
1049 Jackson St Gary, IN 46402
Midtown NeighborhoodEstimated Value: $83,000 - $161,000
4
Beds
2
Baths
1,157
Sq Ft
$113/Sq Ft
Est. Value
About This Home
This home is located at 1049 Jackson St, Gary, IN 46402 and is currently estimated at $130,739, approximately $112 per square foot. 1049 Jackson St is a home located in Lake County with nearby schools including Beveridge Elementary School, Gary Middle School, and West Side Leadership Academy.
Ownership History
Date
Name
Owned For
Owner Type
Purchase Details
Closed on
Oct 19, 2007
Sold by
Acosta Pedro
Bought by
Jordan Takara
Current Estimated Value
Home Financials for this Owner
Home Financials are based on the most recent Mortgage that was taken out on this home.
Original Mortgage
$88,000
Outstanding Balance
$54,657
Interest Rate
6.38%
Mortgage Type
Purchase Money Mortgage
Estimated Equity
$76,082
Purchase Details
Closed on
Jun 20, 2007
Sold by
Fannie Mae
Bought by
Acosta Pedro
Home Financials for this Owner
Home Financials are based on the most recent Mortgage that was taken out on this home.
Original Mortgage
$43,571
Interest Rate
6.37%
Mortgage Type
Unknown
Purchase Details
Closed on
Mar 18, 2007
Sold by
Countrywide Home Loans Inc
Bought by
Federal National Mortgage Association
Purchase Details
Closed on
Mar 16, 2007
Sold by
Cherry Benjamin
Bought by
Countrywide Home Loans Inc
Create a Home Valuation Report for This Property
The Home Valuation Report is an in-depth analysis detailing your home's value as well as a comparison with similar homes in the area
Home Values in the Area
Average Home Value in this Area
Purchase History
| Date | Buyer | Sale Price | Title Company |
|---|---|---|---|
| Jordan Takara | -- | Community Title Company | |
| Acosta Pedro | -- | Ticor Scher | |
| Federal National Mortgage Association | -- | None Available | |
| Countrywide Home Loans Inc | $43,095 | None Available |
Source: Public Records
Mortgage History
| Date | Status | Borrower | Loan Amount |
|---|---|---|---|
| Open | Jordan Takara | $88,000 | |
| Previous Owner | Acosta Pedro | $43,571 |
Source: Public Records
Tax History
| Year | Tax Paid | Tax Assessment Tax Assessment Total Assessment is a certain percentage of the fair market value that is determined by local assessors to be the total taxable value of land and additions on the property. | Land | Improvement |
|---|---|---|---|---|
| 2025 | $815 | $77,000 | $4,900 | $72,100 |
| 2024 | $5,916 | $69,100 | $4,900 | $64,200 |
| 2023 | $635 | $67,100 | $5,000 | $62,100 |
| 2022 | $635 | $56,900 | $1,900 | $55,000 |
| 2021 | $583 | $52,300 | $1,900 | $50,400 |
| 2020 | $591 | $53,000 | $1,900 | $51,100 |
| 2019 | $633 | $57,300 | $1,900 | $55,400 |
| 2018 | $805 | $72,600 | $1,900 | $70,700 |
| 2017 | $819 | $73,300 | $1,900 | $71,400 |
| 2016 | $849 | $76,600 | $1,900 | $74,700 |
| 2014 | $1,010 | $91,700 | $2,300 | $89,400 |
| 2013 | $943 | $88,100 | $2,300 | $85,800 |
Source: Public Records
Map
Nearby Homes
- 1123 - 1125 Van Buren St
- 1148 Jackson St
- 1165 Harrison St
- 833 Tyler St
- 1400 Jackson St
- 1141 Fillmore St
- 1384 Harrison St
- 1109 W 11th Ave
- 1545 Van Buren St
- 1535 Harrison St
- 1168 Fillmore St
- 1273 - 1277 W 17th Ave
- 1105 W 15th Ave
- 565 Jackson St
- 749 Buchanan St
- 743 Buchanan St
- 1769 Van Buren St
- 537 Harrison St
- 1814 Adams St
- 1320 Delaware St
- 1047 Jackson St
- 1053 Jackson St
- 1057 Jackson St
- 1048 Jackson St
- 1044 Jackson St
- 1052 Jackson St
- 1056 Jackson St
- 1060 Jackson St
- 1066 Jackson St
- 1068 Jackson St
- 1055 Van Buren St
- 1041 Van Buren St
- 1057 Van Buren St
- 1061 Van Buren St
- 1065 Van Buren St
- 1069 Van Buren St
- 1073 Van Buren St
- 1077 Van Buren St
- 1048 Van Buren St
- 1056 Van Buren St
Your Personal Tour Guide
Ask me questions while you tour the home.