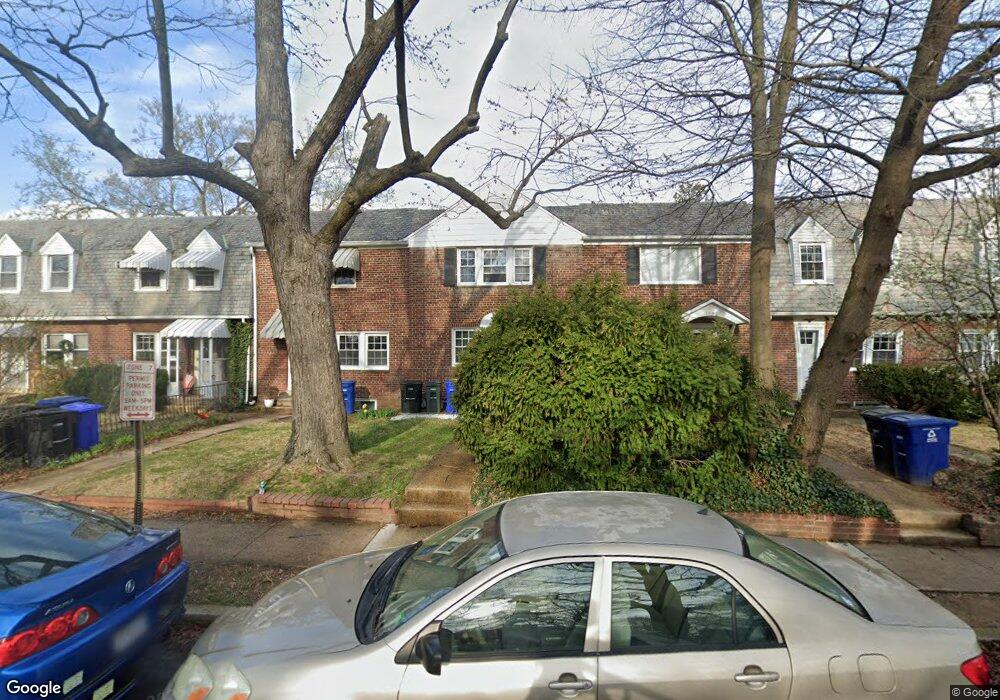
1049 N Nelson St Arlington, VA 22201
Ballston NeighborhoodEstimated Value: $650,767 - $767,000
2
Beds
1
Bath
1,296
Sq Ft
$564/Sq Ft
Est. Value
About This Home
This home is located at 1049 N Nelson St, Arlington, VA 22201 and is currently estimated at $731,192, approximately $564 per square foot. 1049 N Nelson St is a home located in Arlington County with nearby schools including Ashlawn Elementary School, Swanson Middle School, and Washington Liberty High School.
Ownership History
Date
Name
Owned For
Owner Type
Purchase Details
Closed on
Jun 21, 2013
Sold by
Morgan John P
Bought by
Speed Arin
Current Estimated Value
Home Financials for this Owner
Home Financials are based on the most recent Mortgage that was taken out on this home.
Original Mortgage
$424,297
Outstanding Balance
$298,572
Interest Rate
3.25%
Mortgage Type
FHA
Estimated Equity
$432,620
Purchase Details
Closed on
Aug 21, 2001
Sold by
Fiske Russell
Bought by
Morgan John P
Home Financials for this Owner
Home Financials are based on the most recent Mortgage that was taken out on this home.
Original Mortgage
$194,000
Interest Rate
7.06%
Purchase Details
Closed on
Nov 17, 1998
Sold by
Rutz Lorraine S
Bought by
Fiske Russell H
Home Financials for this Owner
Home Financials are based on the most recent Mortgage that was taken out on this home.
Original Mortgage
$73,000
Interest Rate
6.49%
Create a Home Valuation Report for This Property
The Home Valuation Report is an in-depth analysis detailing your home's value as well as a comparison with similar homes in the area
Home Values in the Area
Average Home Value in this Area
Purchase History
| Date | Buyer | Sale Price | Title Company |
|---|---|---|---|
| Speed Arin | $465,000 | -- | |
| Morgan John P | $242,500 | -- | |
| Fiske Russell H | $143,000 | -- |
Source: Public Records
Mortgage History
| Date | Status | Borrower | Loan Amount |
|---|---|---|---|
| Open | Speed Arin | $424,297 | |
| Previous Owner | Morgan John P | $194,000 | |
| Previous Owner | Fiske Russell H | $73,000 |
Source: Public Records
Tax History Compared to Growth
Tax History
| Year | Tax Paid | Tax Assessment Tax Assessment Total Assessment is a certain percentage of the fair market value that is determined by local assessors to be the total taxable value of land and additions on the property. | Land | Improvement |
|---|---|---|---|---|
| 2025 | $7,568 | $732,600 | $575,000 | $157,600 |
| 2024 | $7,355 | $712,000 | $575,000 | $137,000 |
| 2023 | $7,204 | $699,400 | $575,000 | $124,400 |
| 2022 | $7,308 | $709,500 | $575,000 | $134,500 |
| 2021 | $6,466 | $627,800 | $500,000 | $127,800 |
| 2020 | $6,063 | $590,900 | $450,000 | $140,900 |
| 2019 | $5,588 | $544,600 | $425,000 | $119,600 |
| 2018 | $5,258 | $522,700 | $400,000 | $122,700 |
| 2017 | $5,258 | $522,700 | $400,000 | $122,700 |
| 2016 | $4,932 | $497,700 | $375,000 | $122,700 |
| 2015 | $4,872 | $489,200 | $365,000 | $124,200 |
| 2014 | $4,574 | $459,200 | $335,000 | $124,200 |
Source: Public Records
Map
Nearby Homes
- 3515 Washington Blvd Unit 515
- 3625 10th St N Unit 101
- 901 N Monroe St Unit 903
- 901 N Monroe St Unit 1408
- 901 N Monroe St Unit 1013
- 3528 14th St N
- 3800 Fairfax Dr Unit 808
- 1340 N Lynnbrook Dr
- 3835 9th St N Unit 801E
- 3835 9th St N Unit 1001W
- 3409 Wilson Blvd Unit 410
- 3409 Wilson Blvd Unit 611
- 3409 Wilson Blvd Unit 211
- 1001 N Randolph St Unit 215
- 1127 N Kirkwood Rd
- 4103 11th Place N
- 1000 N Randolph St Unit 806
- 1000 N Randolph St Unit 104
- 1055 N Stafford St
- 880 N Pollard St Unit 923
- 1047 N Nelson St
- 1051 N Nelson St
- 1045 N Nelson St
- 1053 N Nelson St
- 1043 N Nelson St
- 1055 N Nelson St
- 1041 N Nelson St
- 1057 N Nelson St
- 1048 N Monroe St
- 1046 N Monroe St
- 1050 N Monroe St
- 1044 N Monroe St
- 1052 N Monroe St
- 1061 N Nelson St
- 1042 N Monroe St
- 1054 N Monroe St
- 1040 N Monroe St
- 1056 N Monroe St
- 1063 N Nelson St
- 1038 N Monroe St