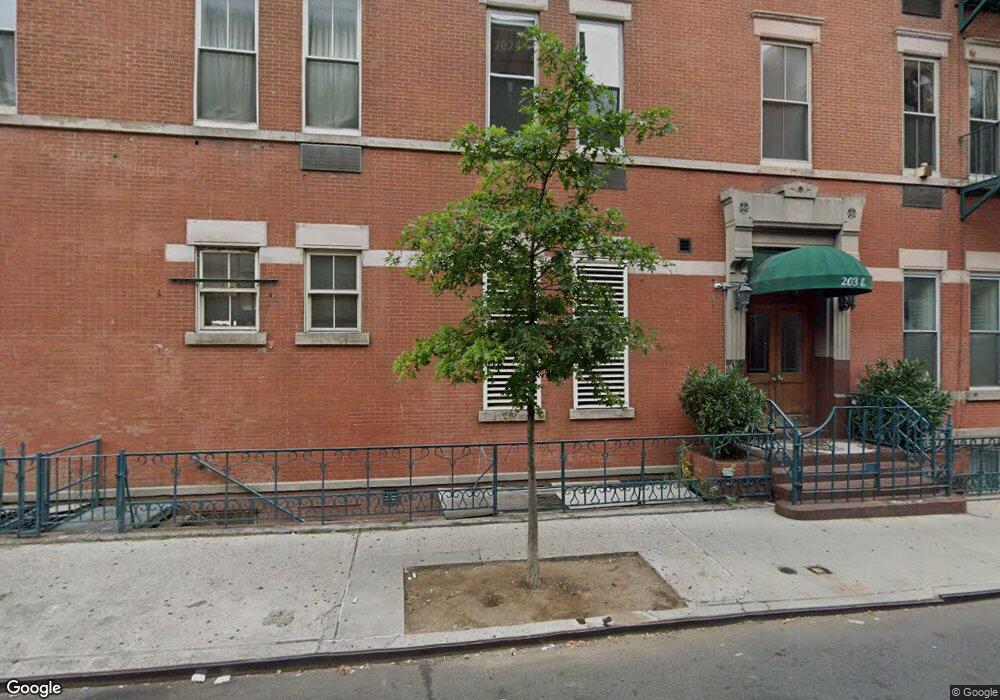
105 3rd Ave Unit 3A New York, NY 10003
East Village NeighborhoodEstimated Value: $1,006,994 - $1,395,000
Studio
--
Bath
710
Sq Ft
$1,675/Sq Ft
Est. Value
About This Home
This home is located at 105 3rd Ave Unit 3A, New York, NY 10003 and is currently estimated at $1,189,499, approximately $1,675 per square foot. 105 3rd Ave Unit 3A is a home located in New York County with nearby schools including East Village Community School, The STAR Academy, and P.S. 34 Franklin D Roosevelt.
Ownership History
Date
Name
Owned For
Owner Type
Purchase Details
Closed on
Jul 24, 2000
Sold by
Flynn Andrew and Jackson Miles C
Bought by
Flynn Andrew D
Current Estimated Value
Home Financials for this Owner
Home Financials are based on the most recent Mortgage that was taken out on this home.
Original Mortgage
$178,000
Outstanding Balance
$63,107
Interest Rate
8.1%
Estimated Equity
$1,126,392
Purchase Details
Closed on
Jun 30, 1998
Sold by
Genack Rhonda
Bought by
Demetriou Athos
Home Financials for this Owner
Home Financials are based on the most recent Mortgage that was taken out on this home.
Original Mortgage
$75,000
Interest Rate
6.86%
Purchase Details
Closed on
Jun 14, 1996
Sold by
Wong James and Lau Helen
Bought by
Genack Rhonda
Home Financials for this Owner
Home Financials are based on the most recent Mortgage that was taken out on this home.
Original Mortgage
$165,000
Interest Rate
8.21%
Create a Home Valuation Report for This Property
The Home Valuation Report is an in-depth analysis detailing your home's value as well as a comparison with similar homes in the area
Home Values in the Area
Average Home Value in this Area
Purchase History
| Date | Buyer | Sale Price | Title Company |
|---|---|---|---|
| Flynn Andrew D | $139,000 | -- | |
| Flynn Andrew D | -- | -- | |
| Demetriou Athos | $345,000 | -- | |
| Demetriou Athos | $345,000 | -- | |
| Genack Rhonda | $220,000 | -- | |
| Genack Rhonda | $220,000 | -- |
Source: Public Records
Mortgage History
| Date | Status | Borrower | Loan Amount |
|---|---|---|---|
| Open | Flynn Andrew D | $178,000 | |
| Closed | Flynn Andrew D | $178,000 | |
| Previous Owner | Demetriou Athos | $75,000 | |
| Previous Owner | Genack Rhonda | $165,000 | |
| Closed | Genack Rhonda | $11,000 |
Source: Public Records
Tax History
| Year | Tax Paid | Tax Assessment Tax Assessment Total Assessment is a certain percentage of the fair market value that is determined by local assessors to be the total taxable value of land and additions on the property. | Land | Improvement |
|---|---|---|---|---|
| 2025 | $10,878 | $87,158 | $24,116 | $63,042 |
| 2024 | $10,878 | $87,007 | $24,116 | $62,891 |
| 2023 | $8,641 | $85,382 | $24,116 | $61,266 |
| 2022 | $8,572 | $84,925 | $24,116 | $60,809 |
| 2021 | $10,549 | $85,991 | $24,116 | $61,875 |
| 2020 | $8,965 | $95,966 | $24,116 | $71,850 |
| 2019 | $8,360 | $89,418 | $24,116 | $65,302 |
| 2018 | $9,615 | $86,474 | $24,116 | $62,358 |
| 2017 | $8,721 | $88,047 | $24,116 | $63,931 |
| 2016 | $8,157 | $84,976 | $24,116 | $60,860 |
| 2015 | $4,239 | $66,018 | $24,116 | $41,902 |
| 2014 | $4,239 | $63,423 | $24,115 | $39,308 |
Source: Public Records
Map
Nearby Homes
- 125 E 12th St Unit 2G
- 125 E 12th St Unit 2A
- 125 E 12th St Unit 1E
- 110 3rd Ave Unit 9A
- 126 E 12th St Unit 2C
- 212 E 13th St Unit 2C
- 212 E 13th St Unit 1C
- 111 3rd Ave Unit 14-A
- 111 3rd Ave Unit 11G
- 114 E 13th St Unit 6B
- 211 E 13th St Unit 5C
- 211 E 13th St Unit 1-C
- 211 E 13th St Unit 6D
- 123 3rd Ave Unit PH18
- 111 4th Ave Unit 2E
- 111 4th Ave Unit 11L
- 111 4th Ave Unit 3-I
- 111 4th Ave Unit 7C
- 111 4th Ave Unit 9C
- 111 4th Ave Unit 3-N
- 105 3rd Ave
- 105 3rd Ave Unit T2
- 105 3rd Ave Unit T1
- 105 3rd Ave Unit 4D
- 105 3rd Ave Unit 4A
- 105 3rd Ave Unit 3C
- 105 3rd Ave Unit 3B
- 105 3rd Ave Unit 2D
- 105 3rd Ave Unit 2C
- 105 3rd Ave Unit 2B
- 105 3rd Ave Unit 2A
- 105 3rd Ave Unit 1B
- 105 3rd Ave Unit LLA
- 105 3rd Ave Unit 1-R
- 105 3rd Ave Unit 3CDF
- 105 3rd Ave Unit 10G
- 105 3rd Ave Unit 17D
- 105 3rd Ave Unit 15D
- 105 3rd Ave Unit 13J
- 105 3rd Ave Unit 17A
Your Personal Tour Guide
Ask me questions while you tour the home.