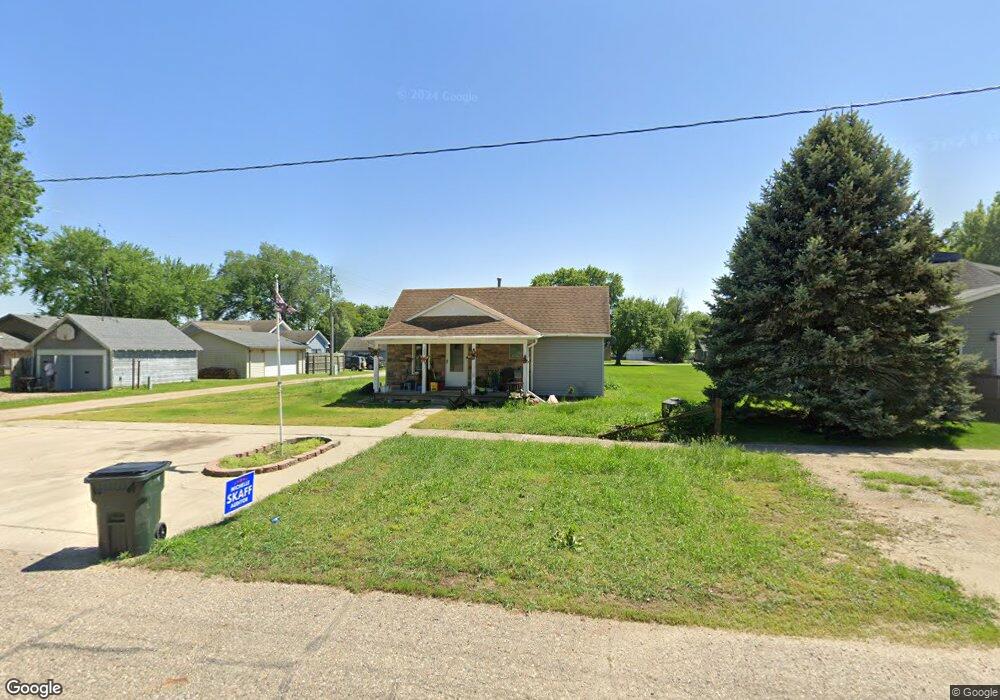
105 3rd St Danbury, IA 51019
Estimated Value: $46,000 - $105,000
1
Bed
1
Bath
874
Sq Ft
$84/Sq Ft
Est. Value
About This Home
This home is located at 105 3rd St, Danbury, IA 51019 and is currently estimated at $73,314, approximately $83 per square foot. 105 3rd St is a home located in Woodbury County with nearby schools including Mapleton Elementary School, Mvao Middle School, and Maple Valley-Anthon Oto High School.
Ownership History
Date
Name
Owned For
Owner Type
Purchase Details
Closed on
May 18, 2011
Sold by
Barry Michael C and Barry Jean M
Bought by
Ladd Dudley
Current Estimated Value
Home Financials for this Owner
Home Financials are based on the most recent Mortgage that was taken out on this home.
Original Mortgage
$26,000
Interest Rate
5.8%
Mortgage Type
Credit Line Revolving
Purchase Details
Closed on
Oct 7, 2010
Sold by
Wyant Russell D and Wyant Adrienne Therese
Bought by
Barry Michael C and Barry Jean M
Create a Home Valuation Report for This Property
The Home Valuation Report is an in-depth analysis detailing your home's value as well as a comparison with similar homes in the area
Home Values in the Area
Average Home Value in this Area
Purchase History
| Date | Buyer | Sale Price | Title Company |
|---|---|---|---|
| Ladd Dudley | -- | -- | |
| Barry Michael C | $19,000 | -- |
Source: Public Records
Mortgage History
| Date | Status | Borrower | Loan Amount |
|---|---|---|---|
| Previous Owner | Ladd Dudley | $26,000 |
Source: Public Records
Tax History Compared to Growth
Tax History
| Year | Tax Paid | Tax Assessment Tax Assessment Total Assessment is a certain percentage of the fair market value that is determined by local assessors to be the total taxable value of land and additions on the property. | Land | Improvement |
|---|---|---|---|---|
| 2025 | $454 | $46,510 | $8,330 | $38,180 |
| 2024 | $454 | $43,830 | $8,330 | $35,500 |
| 2023 | $524 | $43,830 | $8,330 | $35,500 |
| 2022 | $488 | $43,770 | $8,330 | $35,440 |
| 2021 | $488 | $43,770 | $8,330 | $35,440 |
| 2020 | $518 | $42,700 | $8,910 | $33,790 |
| 2019 | $526 | $42,700 | $8,910 | $33,790 |
| 2018 | $506 | $42,700 | $8,910 | $33,790 |
| 2017 | $506 | $42,170 | $8,910 | $33,260 |
| 2016 | $537 | $42,170 | $0 | $0 |
| 2015 | $598 | $39,410 | $8,330 | $31,080 |
| 2014 | $590 | $38,690 | $8,330 | $30,360 |
Source: Public Records
Map
Nearby Homes