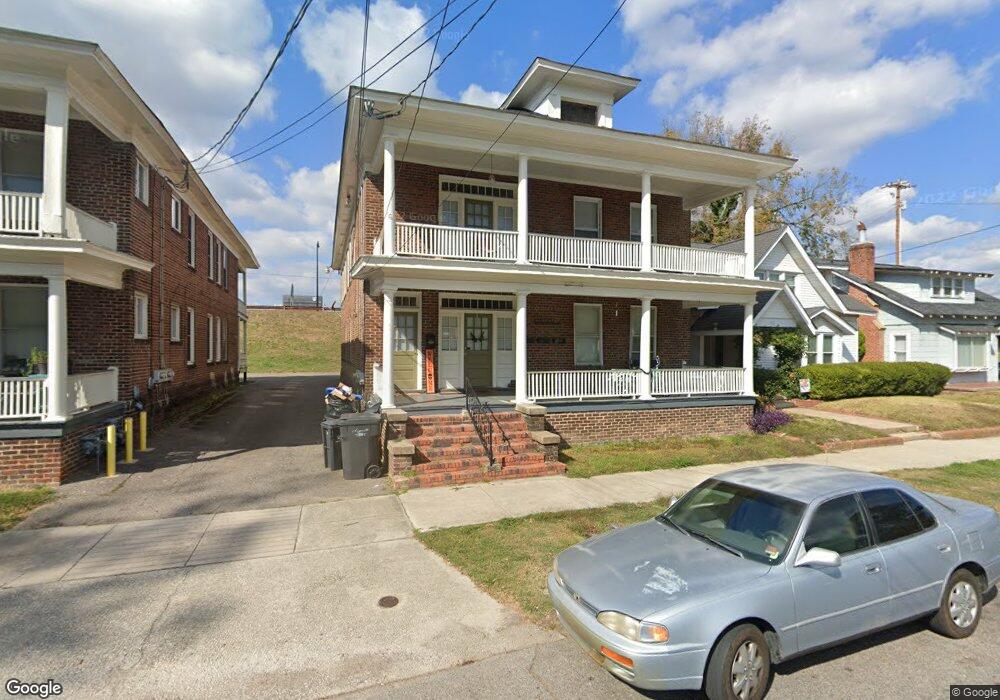
105 4th St Unit A Augusta, GA 30901
Olde Town-Pinched Gut NeighborhoodEstimated Value: $418,000
2
Beds
2
Baths
1,000
Sq Ft
$418/Sq Ft
Est. Value
About This Home
This home is located at 105 4th St Unit A, Augusta, GA 30901 and is currently estimated at $418,000, approximately $418 per square foot. 105 4th St Unit A is a home located in Richmond County with nearby schools including W.S. Hornsby School, W.S. Hornsby Elementary School, and Johnson Magnet.
Ownership History
Date
Name
Owned For
Owner Type
Purchase Details
Closed on
Dec 1, 2021
Sold by
Cone Investment Grp Llc
Bought by
Ohara Elizabeth L and Ohara Brendan J
Current Estimated Value
Purchase Details
Closed on
Nov 26, 2019
Sold by
Ribock John A
Bought by
Cone Investment Grp Llc
Home Financials for this Owner
Home Financials are based on the most recent Mortgage that was taken out on this home.
Original Mortgage
$264,000
Interest Rate
3.7%
Mortgage Type
New Conventional
Purchase Details
Closed on
Apr 27, 1994
Sold by
Trust Company Bank
Bought by
Ribock John A
Create a Home Valuation Report for This Property
The Home Valuation Report is an in-depth analysis detailing your home's value as well as a comparison with similar homes in the area
Home Values in the Area
Average Home Value in this Area
Purchase History
| Date | Buyer | Sale Price | Title Company |
|---|---|---|---|
| Ohara Elizabeth L | -- | -- | |
| Cone Investment Grp Llc | $375,000 | -- | |
| Ribock John A | $45,000 | -- |
Source: Public Records
Mortgage History
| Date | Status | Borrower | Loan Amount |
|---|---|---|---|
| Previous Owner | Cone Investment Grp Llc | $264,000 |
Source: Public Records
Tax History Compared to Growth
Tax History
| Year | Tax Paid | Tax Assessment Tax Assessment Total Assessment is a certain percentage of the fair market value that is determined by local assessors to be the total taxable value of land and additions on the property. | Land | Improvement |
|---|---|---|---|---|
| 2025 | $6,225 | $164,320 | $1,568 | $162,752 |
| 2024 | $6,225 | $148,612 | $1,568 | $147,044 |
| 2023 | $3,642 | $94,128 | $1,568 | $92,560 |
| 2022 | $3,373 | $76,320 | $1,568 | $74,752 |
| 2021 | $2,836 | $41,975 | $1,568 | $40,407 |
| 2020 | $2,806 | $41,975 | $1,568 | $40,407 |
| 2019 | $2,525 | $41,975 | $1,568 | $40,407 |
| 2018 | $2,768 | $39,639 | $1,568 | $38,071 |
| 2017 | $2,651 | $39,639 | $1,568 | $38,071 |
| 2016 | $2,601 | $48,385 | $0 | $0 |
| 2015 | $2,974 | $48,385 | $0 | $0 |
| 2014 | $2,417 | $48,385 | $0 | $0 |
Source: Public Records
Map
Nearby Homes