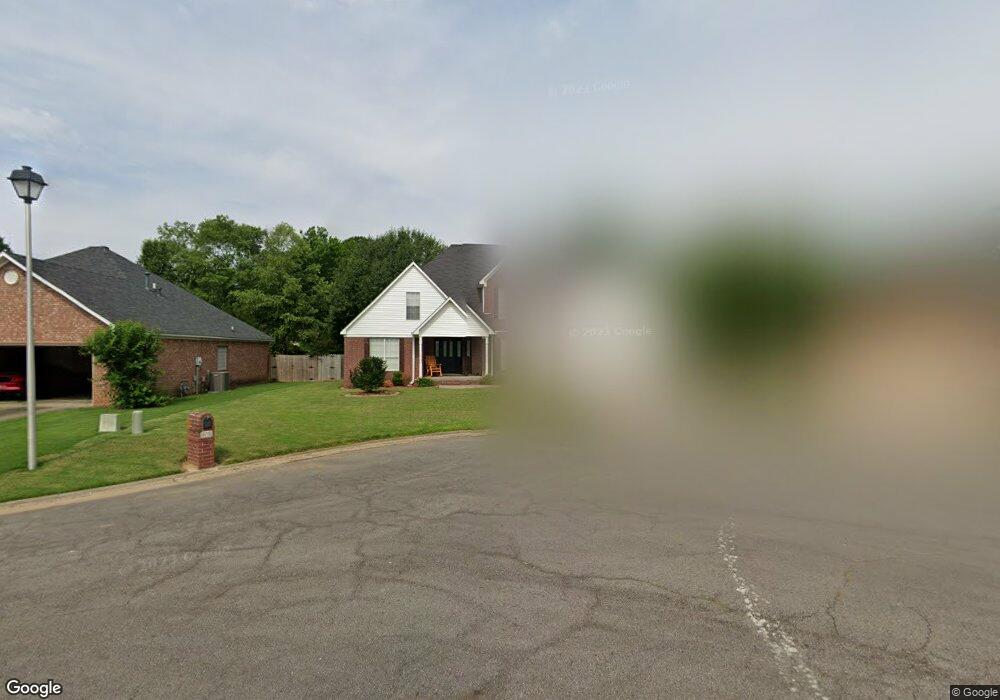
105 Aikman Pass Conway, AR 72034
Southwest Conway NeighborhoodEstimated Value: $344,307 - $405,000
4
Beds
3
Baths
2,381
Sq Ft
$155/Sq Ft
Est. Value
About This Home
This home is located at 105 Aikman Pass, Conway, AR 72034 and is currently estimated at $370,077, approximately $155 per square foot. 105 Aikman Pass is a home located in Faulkner County with nearby schools including Jim Stone Elementary School, Carl Stuart Middle School, and Conway Junior High School.
Ownership History
Date
Name
Owned For
Owner Type
Purchase Details
Closed on
Nov 14, 2017
Sold by
Byrnes Stephanie and Byrnes Anthony
Bought by
Robinson Joshua J and Robinson Amber M
Current Estimated Value
Home Financials for this Owner
Home Financials are based on the most recent Mortgage that was taken out on this home.
Original Mortgage
$239,950
Outstanding Balance
$201,067
Interest Rate
3.85%
Mortgage Type
VA
Estimated Equity
$169,010
Purchase Details
Closed on
May 27, 2015
Sold by
Nagel Todd and Nagel Sarah
Bought by
Byrnes Stephanie and Byrnes Anthony
Purchase Details
Closed on
Nov 4, 2011
Sold by
Jackson Grant E and Jackson Carol M
Bought by
Nagel Todd and Nagel Sarah
Home Financials for this Owner
Home Financials are based on the most recent Mortgage that was taken out on this home.
Original Mortgage
$183,350
Interest Rate
4.08%
Mortgage Type
New Conventional
Purchase Details
Closed on
Mar 24, 1998
Bought by
Jackson
Create a Home Valuation Report for This Property
The Home Valuation Report is an in-depth analysis detailing your home's value as well as a comparison with similar homes in the area
Home Values in the Area
Average Home Value in this Area
Purchase History
| Date | Buyer | Sale Price | Title Company |
|---|---|---|---|
| Robinson Joshua J | $234,900 | Lenders Title Company | |
| Byrnes Stephanie | $215,000 | None Available | |
| Nagel Todd | $193,000 | Conway Title Services & Escr | |
| Jackson | $23,000 | -- |
Source: Public Records
Mortgage History
| Date | Status | Borrower | Loan Amount |
|---|---|---|---|
| Open | Robinson Joshua J | $239,950 | |
| Previous Owner | Nagel Todd | $183,350 |
Source: Public Records
Tax History
| Year | Tax Paid | Tax Assessment Tax Assessment Total Assessment is a certain percentage of the fair market value that is determined by local assessors to be the total taxable value of land and additions on the property. | Land | Improvement |
|---|---|---|---|---|
| 2025 | $2,625 | $66,720 | $5,600 | $61,120 |
| 2024 | $2,506 | $66,720 | $5,600 | $61,120 |
| 2023 | $2,386 | $47,470 | $5,600 | $41,870 |
| 2022 | $1,992 | $47,470 | $5,600 | $41,870 |
| 2021 | $1,888 | $47,470 | $5,600 | $41,870 |
| 2020 | $1,784 | $41,010 | $5,600 | $35,410 |
| 2019 | $1,784 | $41,010 | $5,600 | $35,410 |
| 2018 | $1,809 | $41,010 | $5,600 | $35,410 |
| 2017 | $1,809 | $41,010 | $5,600 | $35,410 |
| 2016 | $1,809 | $41,010 | $5,600 | $35,410 |
| 2015 | $2,011 | $39,750 | $5,600 | $34,150 |
| 2014 | $1,673 | $39,750 | $5,600 | $34,150 |
Source: Public Records
Map
Nearby Homes
- 125 Las Colinas St
- 110 Roosevelt Cir
- 145 Sycamore Springs Dr
- 3530 Bay Berry Rd
- 145 Willow Springs Dr
- 3340 Sylvia Springs Dr
- 3440 Sylvia Springs Dr
- 665 S Hogan Ln
- 377 Reedy Rd
- 2925 Orchard View Dr
- 2915 Orchard View Dr
- Lot 2 Goddard Addition Hogan Ln
- 440 Savannah Park Cir
- 4050 Dave Ward Dr
- 4035 Dave Ward Dr
- 420 Goode Ln
- 104 Country Club Rd
- 4015 Dave Ward Dr
- 4025 Dave Ward Dr
- 3600 Dave Ward Dr
- 115 Aikman Pass
- 3660 Arlington
- 110 Las Colinas St
- 125 Aikman Pass
- 100 Las Colinas St
- 120 Las Colinas St
- 120 Aikman Pass
- 3640 Arlington
- 0 Noblett Dr
- 3645 Noblett Dr
- 135 Aikman Pass
- 3655 Noblett Dr
- 130 Aikman Pass
- 3635 Noblett Dr
- 105 Las Colinas St
- 140 Aikman Pass
- 3665 Noblett Dr
- 3630 Arlington
- 145 Aikman Pass
- 5660 Tivoli Dr
Your Personal Tour Guide
Ask me questions while you tour the home.