Estimated Value: $350,000 - $427,000
3
Beds
2
Baths
1,200
Sq Ft
$323/Sq Ft
Est. Value
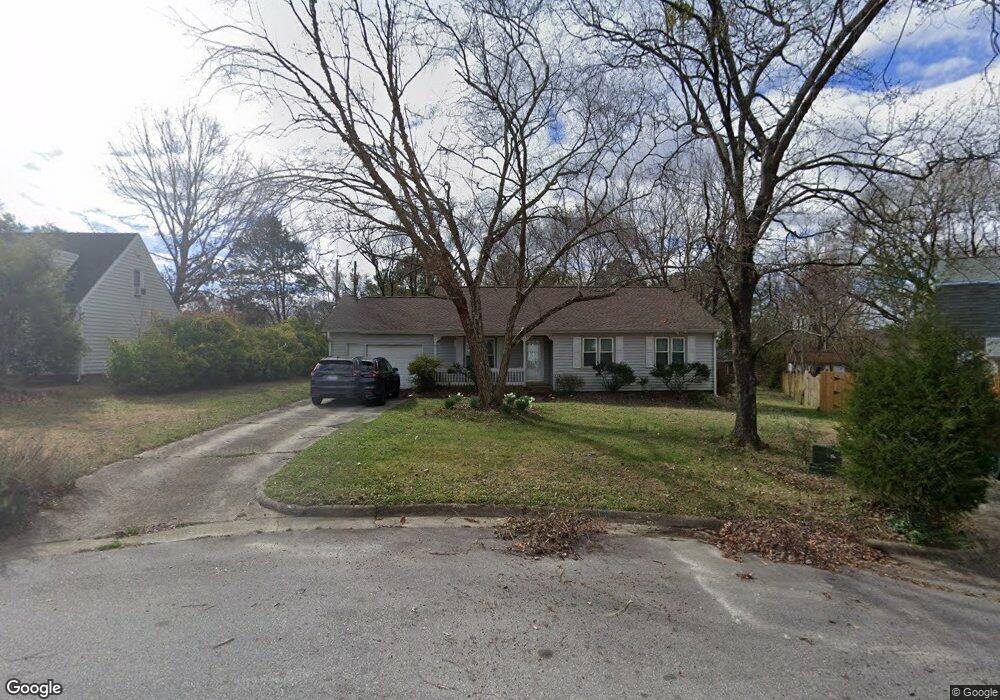
About This Home
This home is located at 105 Avery Le Cir, Apex, NC 27502 and is currently estimated at $387,990, approximately $323 per square foot. 105 Avery Le Cir is a home located in Wake County with nearby schools including Apex Elementary School, Apex Middle, and Apex High School.
Ownership History
Date
Name
Owned For
Owner Type
Purchase Details
Closed on
Sep 18, 2009
Sold by
Ridley James Steven and Ridley Tiffany S
Bought by
Langworthy Thomas
Current Estimated Value
Home Financials for this Owner
Home Financials are based on the most recent Mortgage that was taken out on this home.
Original Mortgage
$118,400
Interest Rate
4.68%
Mortgage Type
Purchase Money Mortgage
Purchase Details
Closed on
Sep 15, 2006
Sold by
Ridley James Steven
Bought by
Ridley James Steven and Ridley Tiffany S
Home Financials for this Owner
Home Financials are based on the most recent Mortgage that was taken out on this home.
Original Mortgage
$29,400
Interest Rate
6.17%
Mortgage Type
Stand Alone Second
Create a Home Valuation Report for This Property
The Home Valuation Report is an in-depth analysis detailing your home's value as well as a comparison with similar homes in the area
Purchase History
| Date | Buyer | Sale Price | Title Company |
|---|---|---|---|
| Langworthy Thomas | $148,000 | None Available | |
| Ridley James Steven | -- | None Available |
Source: Public Records
Mortgage History
| Date | Status | Borrower | Loan Amount |
|---|---|---|---|
| Closed | Langworthy Thomas | $118,400 | |
| Previous Owner | Ridley James Steven | $29,400 | |
| Previous Owner | Ridley James Steven | $117,600 |
Source: Public Records
Tax History
| Year | Tax Paid | Tax Assessment Tax Assessment Total Assessment is a certain percentage of the fair market value that is determined by local assessors to be the total taxable value of land and additions on the property. | Land | Improvement |
|---|---|---|---|---|
| 2025 | $3,294 | $375,021 | $190,000 | $185,021 |
| 2024 | $3,221 | $375,021 | $190,000 | $185,021 |
Source: Public Records
Map
Nearby Homes
- 909 Bryn Mawr Ct
- 314 Wrenn St
- 102 Briarcliff St
- 105 Cunningham St
- 107 N Ellington St
- 327 Old Mill Village Dr
- 311 Culvert St
- 309 Culvert St
- 635 Sawcut Ln
- 631 Sawcut Ln
- 633 Sawcut Ln
- 307 S Elm St
- 406 S Salem St
- 2361 Englemann Dr
- 2374 Englemann Dr
- 2350 Englemann Dr
- 2377 Englemann Dr
- 2357 Englemann Dr
- 2369 Englemann Dr
- 2373 Englemann Dr
- 103 Avery Le Cir
- 107 Avery Le Cir
- 808 Bryn Mawr Ct
- 108 Avery Le Cir
- 806 Bryn Mawr Ct
- 810 Bryn Mawr Ct
- 400 Briarcliff St
- 102 Avery Le Cir
- 106 Avery Le Cir
- 812 Bryn Mawr Ct
- 104 Avery Le Cir
- 100 Avery Le Cir
- 802 Bryn Mawr Ct
- 808 Olive St
- 810 Olive St
- 806 Olive St
- 805 Bryn Mawr Ct
- 807 Bryn Mawr Ct
- 902 Bryn Mawr Ct
- 401 Briarcliff St
Your Personal Tour Guide
Ask me questions while you tour the home.