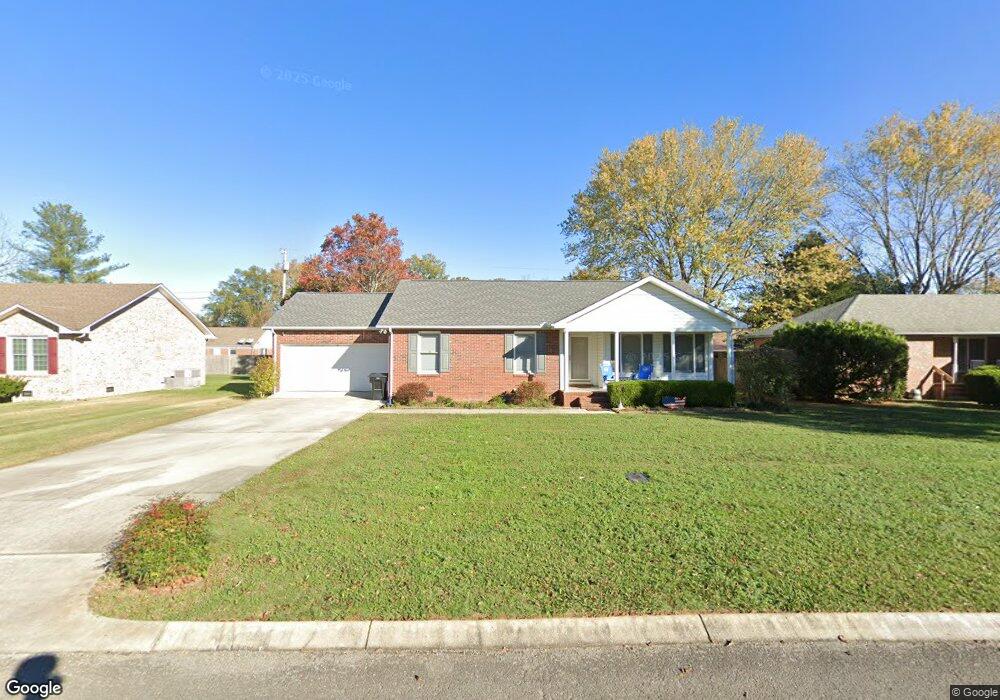
105 Bradbury Ct Tullahoma, TN 37388
Estimated Value: $216,000 - $286,000
--
Bed
2
Baths
1,364
Sq Ft
$184/Sq Ft
Est. Value
About This Home
This home is located at 105 Bradbury Ct, Tullahoma, TN 37388 and is currently estimated at $251,239, approximately $184 per square foot. 105 Bradbury Ct is a home located in Coffee County with nearby schools including Tullahoma High School, Tullahoma Christian Academy, and Highland Rim Christian Academy.
Ownership History
Date
Name
Owned For
Owner Type
Purchase Details
Closed on
Dec 20, 2019
Sold by
Hatfield Ross A and Hatfield Ashley
Bought by
Young Ozey L and Young Teresa S
Current Estimated Value
Purchase Details
Closed on
Jun 15, 2009
Sold by
Hatfield Ross A
Bought by
Hatfield Ross A
Purchase Details
Closed on
Jul 26, 2007
Sold by
Pearson Judith H
Bought by
Hatfield Ross A
Purchase Details
Closed on
Jan 23, 2001
Sold by
Huffman Daniel J and Huffman Sarah
Bought by
Pearson Judith H
Home Financials for this Owner
Home Financials are based on the most recent Mortgage that was taken out on this home.
Original Mortgage
$50,000
Interest Rate
7.18%
Purchase Details
Closed on
Jun 30, 1992
Bought by
Huffman Daniel J
Purchase Details
Closed on
Jan 1, 1984
Bought by
Slaney Farrar Grace M Betsy
Create a Home Valuation Report for This Property
The Home Valuation Report is an in-depth analysis detailing your home's value as well as a comparison with similar homes in the area
Home Values in the Area
Average Home Value in this Area
Purchase History
| Date | Buyer | Sale Price | Title Company |
|---|---|---|---|
| Young Ozey L | $105,000 | Access Title & Escrow Inc | |
| Hatfield Ross A | -- | -- | |
| Hatfield Ross A | $118,000 | -- | |
| Pearson Judith H | $25,600 | -- | |
| Huffman Daniel J | $66,900 | -- | |
| Slaney Farrar Grace M Betsy | $7,500 | -- |
Source: Public Records
Mortgage History
| Date | Status | Borrower | Loan Amount |
|---|---|---|---|
| Previous Owner | Slaney Farrar Grace M Betsy | $50,000 |
Source: Public Records
Tax History Compared to Growth
Tax History
| Year | Tax Paid | Tax Assessment Tax Assessment Total Assessment is a certain percentage of the fair market value that is determined by local assessors to be the total taxable value of land and additions on the property. | Land | Improvement |
|---|---|---|---|---|
| 2024 | $1,668 | $42,700 | $4,250 | $38,450 |
| 2023 | $1,668 | $42,700 | $0 | $0 |
| 2022 | $1,712 | $42,700 | $4,250 | $38,450 |
| 2021 | $1,535 | $30,625 | $3,000 | $27,625 |
| 2020 | $1,535 | $30,625 | $3,000 | $27,625 |
| 2019 | $1,535 | $30,625 | $3,000 | $27,625 |
| 2018 | $1,535 | $30,625 | $3,000 | $27,625 |
| 2017 | $1,515 | $27,700 | $3,000 | $24,700 |
| 2016 | $1,515 | $27,700 | $3,000 | $24,700 |
| 2015 | $1,515 | $27,700 | $3,000 | $24,700 |
| 2014 | $1,516 | $27,710 | $0 | $0 |
Source: Public Records
Map
Nearby Homes
- 207 E Fort St
- 317 Druid Ln
- 102 Essex Ct
- 204 E Blackwell St
- 609 Country Club Dr
- 412 E Hogan St
- 408 NE Atlantic St
- 201 N Fork Branch Rd
- 509 E Grizzard St
- 412 Campbell Ave
- 601 E Grundy St Unit B
- 601 E Grundy St Unit D
- 83 Copperas Creek Falls Rd
- 307 Golf Club Ln
- 412 E Lincoln St
- 107 S Polk St
- 112 S Anderson St
- 808 Maplehill Dr
- 1600 N Washington St Unit 2
- 804 E Grundy St